Saad Ullah

⬤ IREN is getting fresh attention after stabilizing within a major support zone and building what looks like a solid bullish base. The stock has been printing higher lows inside a wide support band, signaling that buyers are still engaged despite a steep drop from the $60-$64 highs. Price is currently sitting in the $41-$42 range, holding ground while the broader structure stays intact.
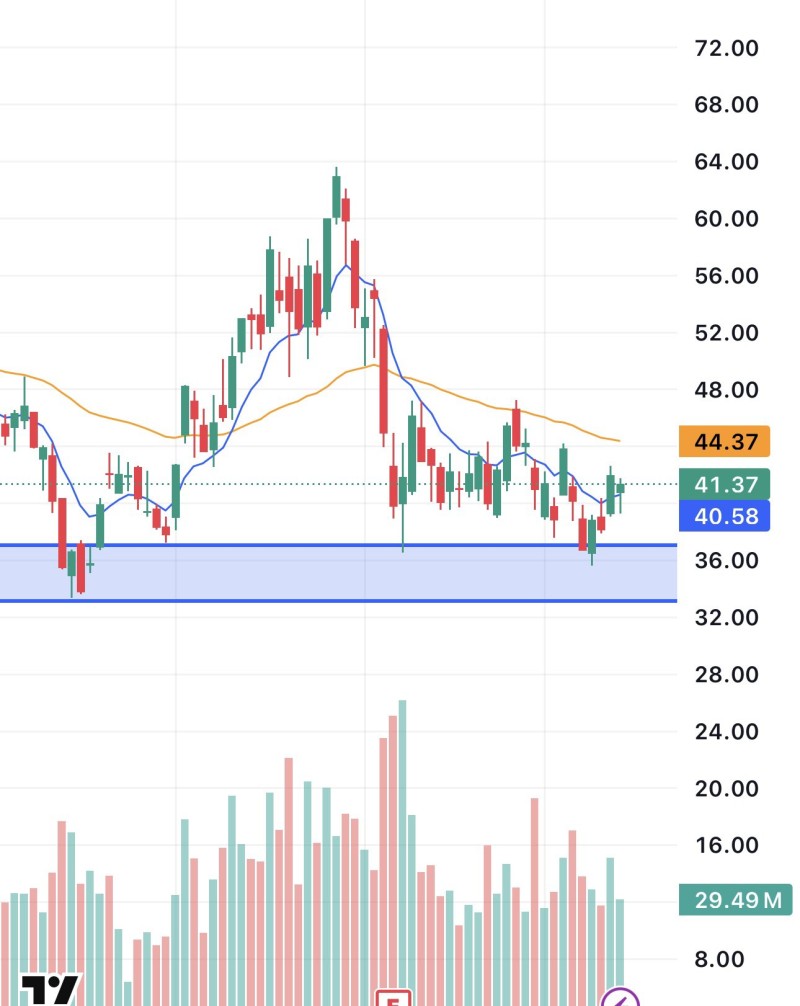
⬤ On the daily chart, IREN recently formed an inside candle, a classic sign of short-term compression before a directional move. Price has also reclaimed the 9-day EMA, which traders typically watch as an early momentum signal. The key trigger here is $42.50: a clean break above that level would likely confirm bullish continuation. This same mid-$40 zone has been flagged as a critical decision point in prior analysis, including IREN Stock Tests $45 Resistance: Will Price Break Higher or Consolidate Further.
⬤ Zooming out, IREN has been cooling off after a strong rally, but the chart keeps showing a steady sequence of higher lows above the $33-$38 support band, a zone that has attracted buyers repeatedly. The structure is tightening between support and resistance, suggesting a bigger move is building. A similar setup played out recently in IREN Stock Rebounds 5.95% From $39.50 Support as Wedge Tightens, where the stock snapped back hard from a comparable area.
⬤ IREN is now sitting at an important technical juncture, trying to rebuild momentum after the earlier decline. If $42.50 gives way, it could open the door for a meaningful leg higher. The stock's ability to hold key levels during consolidation continues to be a defining trait, one that analysts also highlighted in IREN Stock Analysis: $43 Support Holds as $100+ Target Remains in Play, where long-term support remains central to the bull case.
 Saad Ullah