 Artem Voloskovets

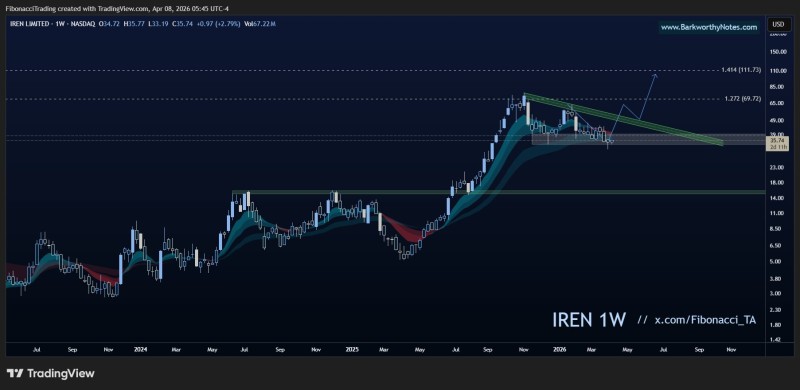
A tightening structure is developing on the weekly chart for IREN, and the setup is straightforward: price is holding support while getting squeezed beneath a descending diagonal trendline. According to Fibby., a technical analyst tracking this name closely, the whole thesis hinges on whether the stock can break above that diagonal and finally confirm a momentum shift.
Support is holding, pressure is building, and the next decisive move will likely come from whichever side breaks first.
IREN Stock Forms Classic Compression Pattern
The weekly chart tells a clear story. After a strong prior uptrend, IREN has moved into a consolidation phase - price is printing lower highs beneath the descending diagonal while buyers continue defending the mid-$30s. That combination creates a textbook compression setup, where volatility contracts and directional energy builds beneath the surface.
These kinds of wedge-like structures in IREN have historically resolved with expansion moves once resistance finally gives way. The longer the compression lasts, the more meaningful the eventual break tends to be.
IREN Support Zone Holds - But the Risk Is Real
The grey support zone in the mid-$30s is still intact. Price has tested this level multiple times without a clean breakdown, which shows buyers are still engaged and defending the area. IREN stock has already demonstrated this dynamic, rebounding sharply from the $39.50 area as the wedge continued tightening.
Buyers are absorbing the pressure, but the structure only holds as long as support does.
That said, the risk here is explicit. If support fails, the entire structure breaks down - continuation becomes invalidation. This zone is the line in the sand that separates the bullish scenario from a potential collapse of the setup.
The Diagonal Trendline Is the Only Trigger That Matters for IREN
Every rally attempt has stalled beneath the descending diagonal trendline. That keeps the overall structure neutral - not bearish, but not bullish either. IREN is effectively going nowhere until something changes at that trendline.
A clean break above it is the one confirmation trigger that flips the picture. Without it, the stock remains range-bound regardless of how well support is holding. Previous analysis of IREN around the $43 level pointed to the same dynamic - support can hold indefinitely, but upside targets only come into play after a genuine breakout.
IREN Breakout Targets: $70 First, Then $111
The upside scenario is conditional - it only becomes valid after the breakout is confirmed. Here is what the structure points to once that happens:
- A break above the diagonal trendline confirms a momentum shift
- First upside target sits near $70
- Extended move could reach $111
A wedge breakout toward the $60-$70 range has been in focus for some time, and the structure continues building toward that potential resolution.
The setup is defined. Either the diagonal breaks and targets open up, or support fails and the structure resets lower.
Until one of those happens, IREN stays compressed - a coiled spring waiting on a catalyst.
 Artem Voloskovets


