 Usman Salis

⬤ IREN Limited is entering a decisive technical phase as price continues to compress within a narrowing formation. The stock is producing lower highs and higher lows on the two-week timeframe, forming a wedge pattern that typically precedes a breakout.
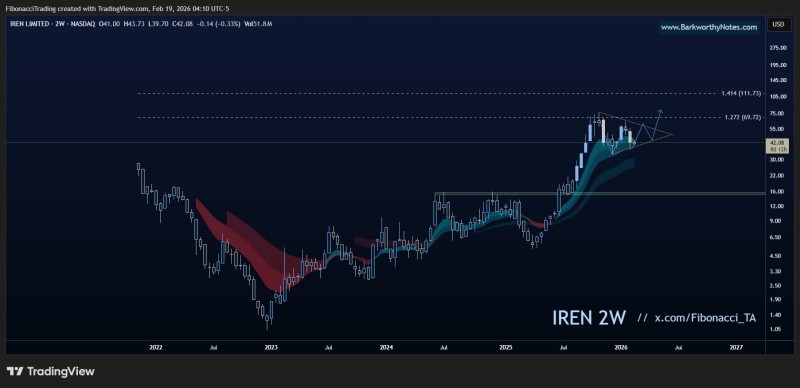
⬤ The chart shows IREN recovering from a prolonged decline in 2022 before establishing a sustained uptrend into 2024 and 2025. Price advanced sharply toward the $60-$70 region and then transitioned into consolidation. Since then, volatility has contracted while candles tightened inside converging trendlines. This behavior reflects equilibrium between buyers and sellers rather than directional dominance, similar to structures seen during recent IREN stock weakness below resistance.
⬤ The technical structure highlights overhead resistance near the upper wedge boundary and rising support along the lower trendline. The compression zone suggests momentum is building beneath the surface. Once price escapes the formation, expansion typically follows as positioning resolves. Comparable pressure previously appeared when IREN stock dropped after losing key support.
⬤ The importance of the current setup lies in direction rather than timing. A confirmed break above resistance would signal trend continuation, while rejection could trigger a broader consolidation phase. The wedge is now at its tightest point, meaning traders are watching closely for volume confirmation on either side. This makes the next move particularly significant for anyone tracking IREN's medium-term trajectory.
 Usman Salis


