 Eseandre Mordi

Donald Dean, who flagged this setup in his original analysis, notes that IREN Limited is working through a consolidation phase, with a key breakout level emerging just above current price action - making this a critical moment for traders watching the stock market trend.
Where the IREN Stock Downtrend Still Holds Control
The chart shows IREN transitioning from a prior uptrend into a clear sequence of lower highs, defined by a descending resistance line. Each rally attempt has been capped beneath this trendline, reinforcing a controlled pullback rather than a reversal.
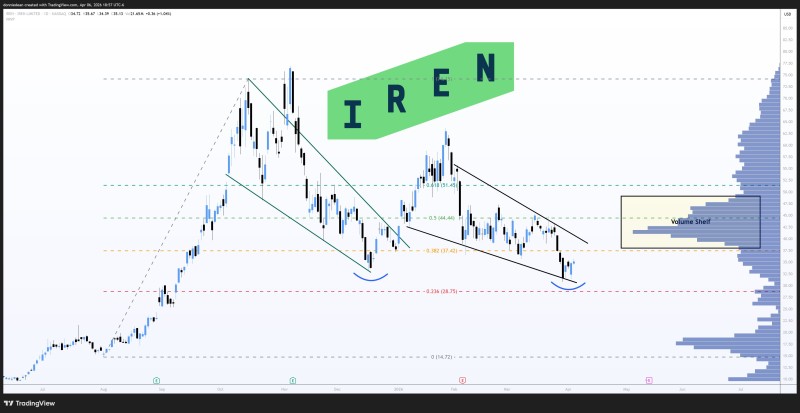
After peaking earlier, price failed to sustain momentum near the upper range and moved steadily lower. The IREN stock analysis: $43 support holds documented the rejection near the 0.618 Fibonacci level around $51.45 - a key turning point that aligned with levels referenced in prior coverage.
The stock is working through a consolidation phase, with a key breakout level emerging just above current price action.
The Double Bottom Taking Shape Near $28-$30
Recent price action highlights two distinct reactions near the $28-$30 zone, forming what resembles a developing double bottom. This area coincides closely with the 0.236 Fibonacci level (~$28.75), where buyers have stepped in twice to defend support.
While the broader trend remains technically weak, this repeated defense suggests selling pressure may be fading, transitioning the structure into consolidation rather than continuation lower. As covered in IREN stock rebounds from $39.50 support, the stock has a history of sharp recoveries once key zones hold.
With support holding and volatility contracting, the chart suggests a decisive move may be approaching.
Why $40 Is the Key IREN Stock Breakout Level
The $40 level stands out as the immediate trigger point. It aligns with:
- A descending resistance trendline
- A prior consolidation zone
- A visible volume shelf on the right side of the chart
This volume shelf represents a zone of heavy historical trading activity, where price previously stalled. A breakout above $40 would signal acceptance above this region and open the path toward the next key level. Clearing this resistance would likely shift momentum toward the 0.618 Fibonacci level at $51.45, which remains the next upside reference.
IREN Stock Compression Before the Next Move
Price is now trading within a tightening range between support near $30 and resistance near $40. This compression reflects a market in balance, where neither buyers nor sellers have full control.
The IREN stock compresses in wedge pattern piece captured a similar structure, which ultimately preceded a directional move once resistance gave way.
The structure remains neutral-to-bearish until $40 is reclaimed - but a decisive move may be approaching.
For now, the setup stays cautious until $40 is cleared. But with support holding and volatility contracting, the chart suggests the next directional move will define whether IREN stock continues its correction or begins a new upward phase.
 Eseandre Mordi


