Usman Salis

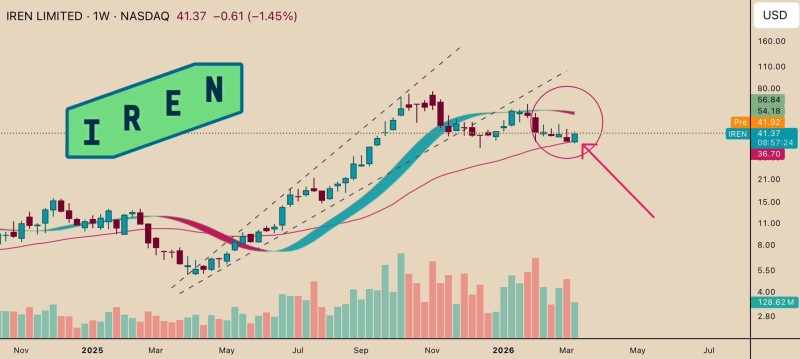
⬤IREN Limited is holding near the $41 area after bouncing off its 200-day moving average, currently positioned around $37. Buyers have stepped in at that level for now, keeping a deeper selloff at bay. The question is whether that defense can hold if selling pressure picks up.
⬤The recovery from the 200-day MA is a constructive sign - demand is still present during pullbacks. That same dynamic was visible when IREN stock near $40.95 as traders brace for volatile Monday open, where price consolidated after a prior rally rather than rolling over sharply.
⬤The negatives are harder to ignore. IREN rejected the weekly Hull Moving Average in early 2026, and the moving average ribbon has since turned bearish, sloping downward. Ribbon resistance is now parked in the $54-$57 zone - a ceiling that's been blocking every recovery attempt. As covered in IREN stock tests $45 resistance: will price break higher or consolidate further, clearing these levels is a prerequisite for any trend continuation.
⬤A close below $37 on strong volume would be a clear warning sign - the chart points to further downside before any meaningful stabilization. On the flip side, IREN stock rebounds from $39.50 support as wedge tightens showed how price compression near support can precede a decisive move. Continued buyer defense here would suggest the broader structure is still intact.
⬤For now, IREN sits at a technical crossroads: 200-day MA support below, bearish ribbon resistance above. The next directional move - and the volume behind it - will likely set the tone for weeks ahead.
 Usman Salis