 Eseandre Mordi

IREN Limited is entering a critical technical zone. After surging from under $10 to nearly $70, the stock is now compressing into a wedge formation around $44.94 - and traders are watching closely for what comes next.
Wedge Structure Signals Volatility Contraction Before Next Move
The weekly chart tells a clear story: a powerful uptrend followed by a controlled pullback. IREN printed lower highs while sustaining higher lows, forming a textbook wedge. The lower trendline is holding firm in the high-$30 to low-$40 range, while descending resistance is capping price action in the $50-$60 zone. Sky, an analyst tracking the setup, notes that accumulation is likely to continue as long as the wedge holds.
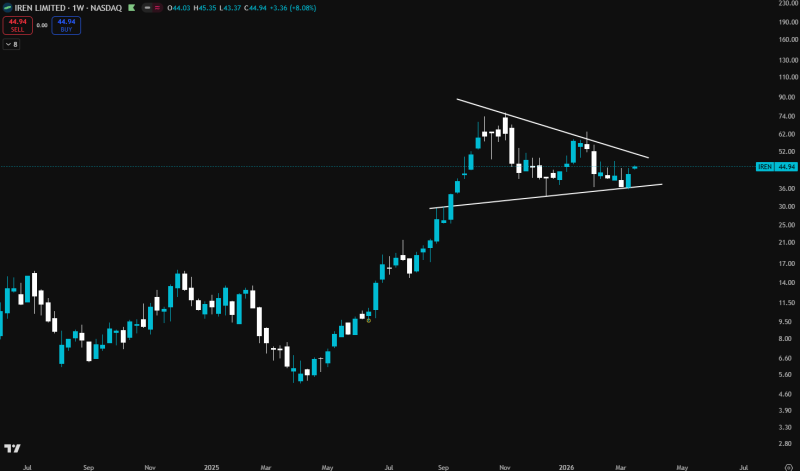
As highlighted in IREN Stock Eyes Breakout From Wedge Pattern With $33 Invalidation Level, the $33 area represents the key invalidation threshold - a breakdown below that level would shift the bias.
$87-$115 Target Zone Stays in Play as Support Holds Near $43
Market sentiment remains constructive. The consistent series of higher lows points to underlying demand that has not broken down despite the corrective phase. IREN Stock Analysis: $43 Support Holds as $100+ Target Remains in Play outlines how a confirmed breakout from the current range could open a path toward $87-$115, keeping the $100 narrative intact. Similar price behavior was flagged earlier in IREN Stock Compresses in Wedge Pattern as $60-$70 Breakout Approaches, where tightening action ultimately preceded expansion.
The setup is binary from here. Holding above support preserves the bullish structure and keeps the $100+ target on the table. A breakout above the descending resistance line could trigger momentum continuation. A break below support, however, would invalidate the pattern and push any meaningful rally further out.
 Eseandre Mordi


