 Saad Ullah
⬤ IREN Limited has compressed into a narrowing wedge pattern, suggesting a possible breakout if price pushes above resistance. The chart shows shares forming lower highs and higher lows - a classic sign of decreasing volatility before what traders typically view as a significant directional move. This setup follows recent sideways action as IREN tries to establish clear trend direction after consolidation. The key invalidation point sits below $33, and holding above this level keeps the bullish structure alive.
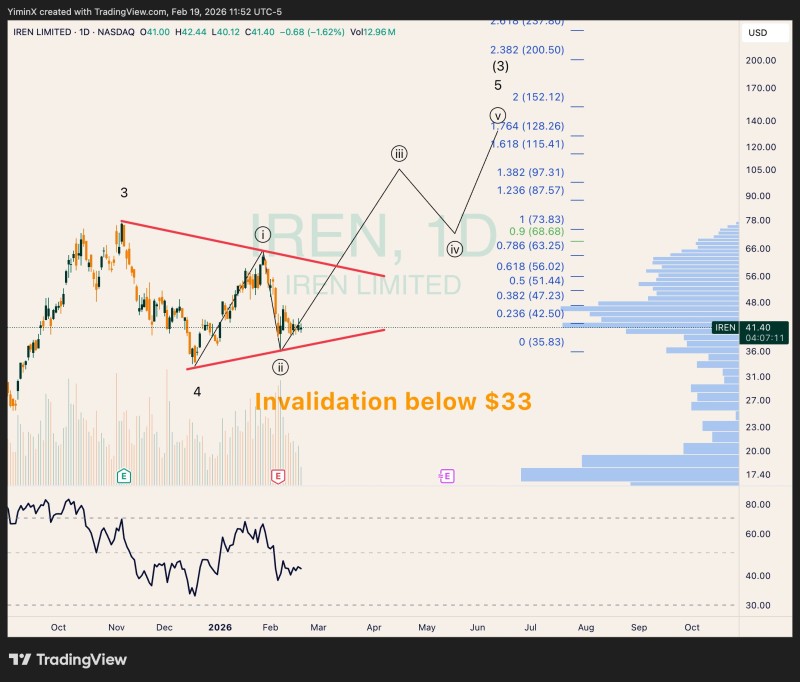
⬤ The tightening range could lead to an expansion once the wedge resolves. IREN has struggled to find sustained upward momentum recently, but the contraction signals buyers and sellers are reaching equilibrium. A convincing break above the upper trendline could target higher price zones previously identified by market watchers. As one technical analyst noted, "The compression in this wedge is textbook - it's coiling for either a breakout or breakdown." Similar patterns were covered in IREN Stock Compresses in Wedge Pattern as $60-$70 Breakout Approaches, where the technical structure showed tightening ahead of potential moves.
⬤ IREN has historically shown volatility through major rallies and pullbacks, making this consolidation phase important to monitor. The stock recently tested key moving average resistance and bounced from support zones, highlighting its sensitivity near critical price levels. Earlier coverage at IREN Rebounds From $45 Support, Eyes $76.87 Previous High offers context on how IREN interacts with major support and resistance.
⬤ With markets digesting macro trends and tech sector developments, this wedge pattern marks an inflection point that could impact sentiment across growth and infrastructure stocks. A confirmed break above technical barriers may trigger renewed interest, while failure could extend the sideways phase and signal broader momentum shifts within tech and mining equities.
 Saad Ullah


