 Saad Ullah
Hims & Hers Health continues to trade under pressure, with technicals pointing to further downside before any meaningful recovery can take shape. According to Fibby., a Fibonacci-focused technical analyst, a move toward $17 could form a higher low - potentially the first structural step toward a reversal.
HIMS Stock Downtrend Still Controls Price Action
The weekly chart tells a clear story: HIMS keeps getting rejected near the EMA cloud, which continues to act as dynamic resistance and keeps the broader trend firmly bearish.
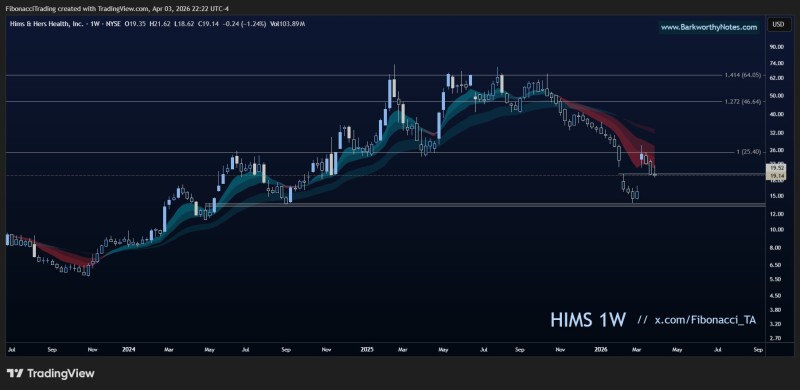
Recent candles show no signs of recovery, with price unable to reclaim higher levels across multiple timeframes. The stock remains below its major moving averages, and selling pressure has yet to let up in any meaningful way.
Why the $17 Level Matters for HIMS Price Structure
The case for watching $17 is less about momentum and more about market structure. If HIMS reaches that level and holds, it would print a higher low compared to recent swing lows - a meaningful development after a prolonged series of lower lows.
A move to $17 that holds as a higher low would be the first real sign of stabilization after an extended decline.
That kind of shift is typically the first sign that a downtrend is losing steam. HIMS has already fallen more than 75% from its $60 peak, which makes any stabilization near a historically important support zone worth paying close attention to.
The EMA Cloud Is the Line to Watch for HIMS
Even if a higher low forms at $17, the trend does not flip bullish automatically. The EMA cloud remains the defining obstacle.
A confirmed break above that zone is what it would take to shift the structure from bearish to neutral, and eventually bullish. Until that happens, every rally attempt is likely to stall at the same level that has been capping price for weeks.
Prior analysis had HIMS targeting a $15.75 weekly close following a 50% decline, which adds further context to just how compressed the stock has become at current levels.
The Three-Step Sequence That Could Reverse HIMS Stock
The technical setup follows a straightforward progression:
- A move down toward $17
- Formation of a higher low at that level
- A renewed attempt to break above the EMA cloud
If this sequence plays out, it marks the first structural change after a prolonged downtrend - and that changes how the chart reads going forward.
Each step depends on the one before it. There is no reversal without the higher low, and no trend change without reclaiming the EMA cloud. Longer-term targets as high as $130 remain on the table under certain Elliott Wave counts, but those scenarios require the structure to start shifting first.
For now, HIMS remains in a bearish phase. The next reaction near $17 will be the clearest signal yet of whether this stock is ready to stabilize - or has more ground left to lose.
 Saad Ullah


