 Marina Lyubimova
⬤ Hims & Hers Health Inc. stock is hovering near a crucial technical pivot as HIMS attempts to reclaim the 0.786 logarithmic Fibonacci level at $15.75 on the weekly timeframe. First sign of a potential bottom forming would be a weekly close above that retracement level. The chart currently shows HIMS with a weekly close around $15.89, placing price slightly above the $15.75 threshold as the week winds down.
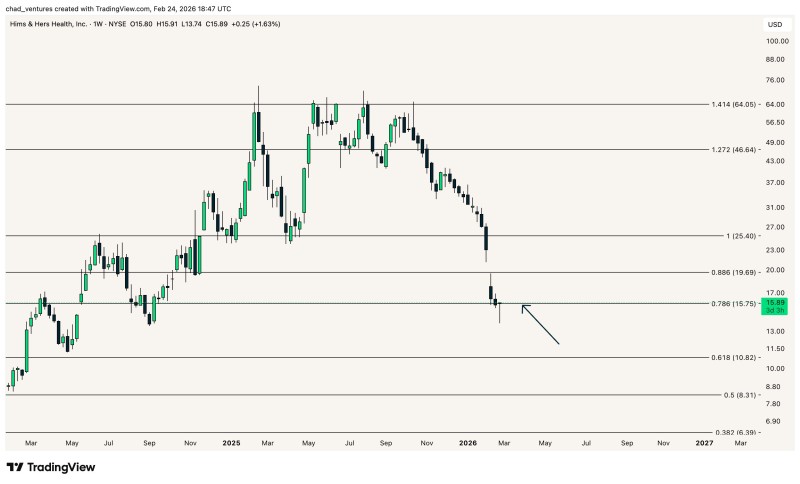
⬤ The broader price structure reveals a brutal decline from previous highs in the $60 to $64 range, aligning with the upper Fibonacci marking near 1.414 at $64.05. Since peaking, HIMS has surrendered over 50% from its highs, sliding through multiple technical zones before landing in the deep retracement region where the 0.786 level at $15.75 now sits. This area is acting as a critical decision point, with price action compressing as support and resistance converge around the same band.
⬤ Candlestick behavior adds another layer to the setup. This means the final weekly candle shape matters just as much as the level itself, since a hammer pattern implies rejection of lower prices and a stronger close back above the key zone. Until the weekly close prints, the signal remains unconfirmed and conditional.
⬤ This analysis matters because HIMS is testing a single level that could reshape the near-term narrative. If HIMS holds above the 0.786 retracement on a closing basis, it could shift sentiment toward bottoming behavior and open the door for a potential reversal setup targeting higher resistance zones. Failure to close above $15.75 keeps the focus squarely on continued downside risk and structural weakness in the trend.
 Marina Lyubimova


