 Marina Lyubimova

Hims & Hers Health has pulled back sharply over the past several months, with shares now trading near $15.74 after peaking above $60. Despite the steep correction, a segment of the technical analysis community is sticking with a long-term bullish framework that still points toward a much higher price target if the broader cycle resumes.
The stock has been testing the $15.75 support level after a five-month decline, a zone that technical analysts are watching closely as a potential floor following sustained selling pressure. The current weakness represents a deep retracement from the prior impulsive rally, and how the stock responds around this level could shape its next directional move.
Fibonacci Retracement Levels Define the Current Support Zone
The corrective phase that followed HIMS's earlier wave (1) rally has pushed the stock through several key Fibonacci retracement levels. The 0.618 retracement sits near $29.94, while deeper levels at 0.786 and 0.88 fall around $18.01 and $11.33 respectively. HIMS is currently trading in oversold territory with key support at $15 and $13.60, an area where markets sometimes attempt stabilization after extended declines.
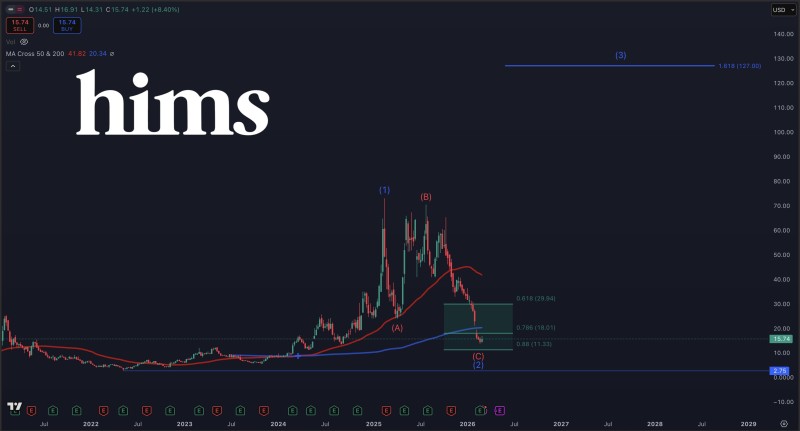
The corrective structure consists of labeled waves (A), (B), and (C), following the completed impulse from the initial rally. Price has now retraced into the deeper end of the Fibonacci grid, which some analysts treat as a potential accumulation area before any future resumption of the broader trend.
Long-Term Wave (3) Projection Keeps $127 on the Radar
Despite current weakness, the long-term Elliott Wave count remains intact for analysts following this framework. HIMS is now testing a critical 2021 support level following the sharp decline, a zone that could serve as the base for a future impulsive wave (3) move if the structure holds.
In Elliott Wave theory, wave (3) typically represents the most powerful expansion phase of a cycle, frequently surpassing the length of wave (1) by a significant margin. Fibonacci extension projections applied to the current count place a theoretical long-term target near $127. While that level remains a speculative outcome dependent on a full structural reversal, analysts tracking this model note that the current correction does not invalidate the broader bullish scenario as long as key support levels hold.
 Marina Lyubimova


