 Marina Lyubimova

Hims & Hers Health surged past the $26 strike, which had been the largest gamma concentration on the options chain. Premarket trading pushed HIMS above $27, breaking through the biggest gamma wall on the board and forcing a rapid shift in dealer hedging dynamics.
How the $26 Gamma Wall Was Acting as Resistance
Gamma exposure (GEX) charts show how market makers hedge options positions as price moves between strikes. With a large call cluster sitting at $26, dealers short those calls were selling stock into rallies near that level, creating mechanical resistance. Once HIMS broke above the strike, those calls moved deeper in the money and dealers had to buy shares to stay delta-neutral, adding fresh buying pressure to the move.
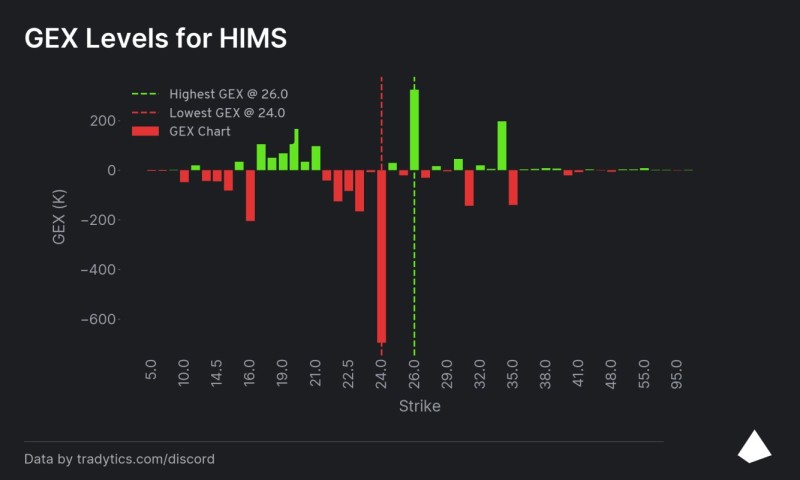
What $24 Support and Thin Gamma Above $26 Mean for Traders
The structure above $26 is notably thin, with few large options clusters that could slow the rally. That kind of open space can let price run faster. On the downside, the GEX chart marks $24 as the lowest gamma concentration, making it a key level to watch if HIMS reverses. A drop back through $25 could flip dealer hedging dynamics again, and the negative gamma pocket near $24 may amplify any downside volatility.
The $26 strike now acts as the first support after the breakout. Similar positioning dynamics shaped earlier moves covered in HIMS Stock Analysis: Record 81M Shares Shorted as Price Diverges, while the pattern of sharp recoveries was detailed in HIMS Stock Pops 13.5% as Hims & Hers Rebounds From $14.50 Area. The broader technical backdrop was outlined in HIMS Stock Eyes $15.75 Weekly Close After 50% Decline.
 Marina Lyubimova


