 Saad Ullah
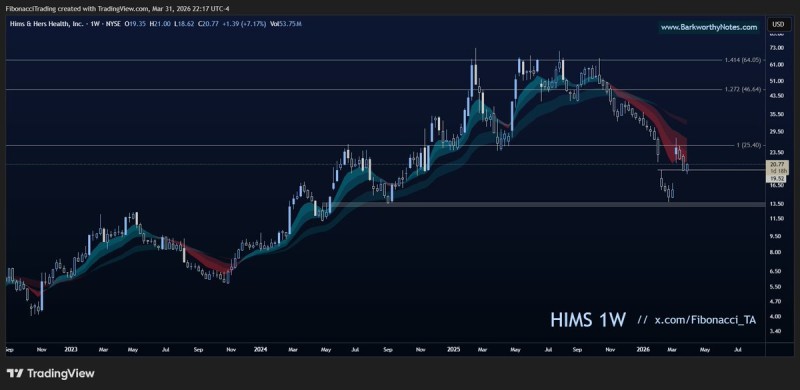
Hims & Hers stock is at a critical junction. After a sustained decline from the $60+ region, price has stabilized near $19.50 and is showing early signs of basing. technical analyst Fibby flagged the setup, pointing out that the stock held this key horizontal support and reacted higher - setting up a potential structural shift if buyers can follow through.
The bigger question now is whether that reaction turns into something more meaningful, or whether the broader downtrend simply reasserts itself.
HIMS held the $19.50 mark and reacted higher from that level - this area stands out as a clear horizontal support zone following a prolonged downtrend
The $19.50 HIMS Support Level That Defined the Bounce
On the weekly chart, $19.50 isn't just a round number - it marks a recognizable horizontal support zone that has held up after weeks of consecutive lower highs and sustained selling pressure. The reaction at this level represents the first meaningful pause in the decline, signaling that buyers are starting to step in rather than stand aside.
This lines up with broader HIMS technical observations showing the stock testing similar support zones after repeated rejections from the EMA cloud above.
A Higher Low Is the Next Requirement for HIMS Structure
Holding support is necessary, but it's not enough on its own. The next requirement is a confirmed higher low - something that hasn't materialized yet, but which the current bounce creates the conditions for. Until it does, the structure remains transitional:
- The broader downtrend is still intact
- Price has reacted from support but has not broken resistance
- The market is attempting to stabilize after a sharp decline
A higher low would interrupt the sequence of lower lows that has defined the move from $60+, and would be the first concrete sign that selling pressure is beginning to fade.
A higher low would interrupt the pattern of lower lows and signal that selling pressure is beginning to weaken - the current bounce creates the conditions for it, but confirmation is still needed
EMA Cloud Remains the Key HIMS Barrier
Above current price sits the EMA cloud, which has acted as consistent resistance throughout the decline. The chart shows multiple failed attempts to reclaim this zone - each one reinforcing just how significant that overhead area is.
Price is now positioned below that same region again. According to the analysis, a move back into the EMA cloud would represent the next meaningful step in shifting the overall structure. Until that happens, HIMS remains in a corrective phase where any rally is still capped by overhead resistance. HIMS free cash flow metrics returning to 2024 levels add further context to the pressure the stock has been under.
The Path Toward $46 Depends on a HIMS Structure Shift
The upside target flagged in the analysis is $46 - a level that aligns with a prior resistance zone visible on the weekly chart. But reaching it is conditional on two things happening first: a confirmed higher low, and a break back into the EMA cloud. Without both, the broader trend hasn't shifted.
The $46 scenario remains conditional - without a confirmed higher low and a break into the EMA region, the broader trend has not yet shifted and rallies remain capped
Similar conditional setups have been noted in recent coverage, where HIMS revenue projections reaching $4.13B by 2029 still come with the caveat that volatility remains elevated and technical structure needs to cooperate before any sustained recovery can develop.
For now, HIMS is holding a key level - but the structure is incomplete. The next move depends entirely on whether buyers can build on this support and produce a higher low, or whether the downtrend simply resumes from here.
 Saad Ullah


