 Saad Ullah
The relationship between Hims & Hers stock and its underlying financials has come back into sharp focus. According to Qualtrim, FCF per share has reverted to 2024 levels - and the stock price has followed, illustrating a consistent and measurable connection between market valuation and cash flow performance.
Earlier in 2025, HIMS stock climbed sharply as free cash flow per share also moved higher. The two metrics rose together, reinforcing each other. But as FCF per share began pulling back toward 2024 levels, price action followed without delay.
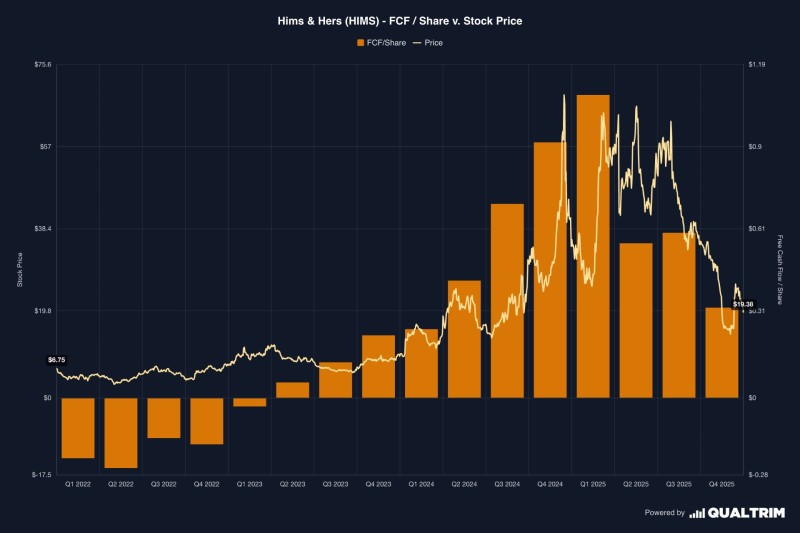
Free cash flow per share has returned to 2024 levels - and the stock price has followed, highlighting a consistent relationship between fundamentals and market pricing.
Rather than holding at elevated levels, HIMS adjusted downward alongside the drop in cash flow per share. The result is a reset - both metrics now sitting near where they were roughly a year ago.
This kind of parallel movement is exactly what fundamental-focused investors watch for. It confirms that the market is pricing HIMS based on what the business actually generates, not on expectations that have drifted away from reality.
A Structure That Mirrors HIMS Fundamentals
The earlier divergence between price and FCF per share has now resolved. Both indicators are currently positioned near 2024 levels, suggesting valuation has normalized relative to underlying cash flow. Similar patterns have been documented in broader equity market analysis, where valuation compression frequently follows declines in core financial metrics like free cash flow.
When FCF per share rises, price trends higher. When it falls, price adjusts accordingly.
The chart makes this dynamic visible across multiple timeframes - not as a one-time coincidence, but as a recurring structural pattern in how HIMS is priced.
HIMS Free Cash Flow Signal: What Investors Are Watching Now
The key takeaway is consistency. HIMS stock is not moving independently of its fundamentals. It is tracking changes in free cash flow per share in a direct and measurable way.
With both price and FCF per share now aligned at lower levels, the setup raises a straightforward question for investors: does cash flow recover from here, or does it continue sliding?
Over time, market valuation tends to follow cash flow performance - and HIMS is no exception.That answer will likely determine the stock's next directional move. For now, the chart tells a clear story - one where fundamentals are in the driver's seat. Investors tracking HIMS can also follow the key bullish crossover signalthat emerged during the stock's earlier 92% rally for additional technical context.
That answer will likely determine the stock's next directional move. For now, the chart tells a clear story - one where fundamentals are in the driver's seat. Investors tracking HIMS can also follow the key bullish crossover signal that emerged during the stock's earlier 92% rally for additional technical context.
 Saad Ullah


