 Saad Ullah

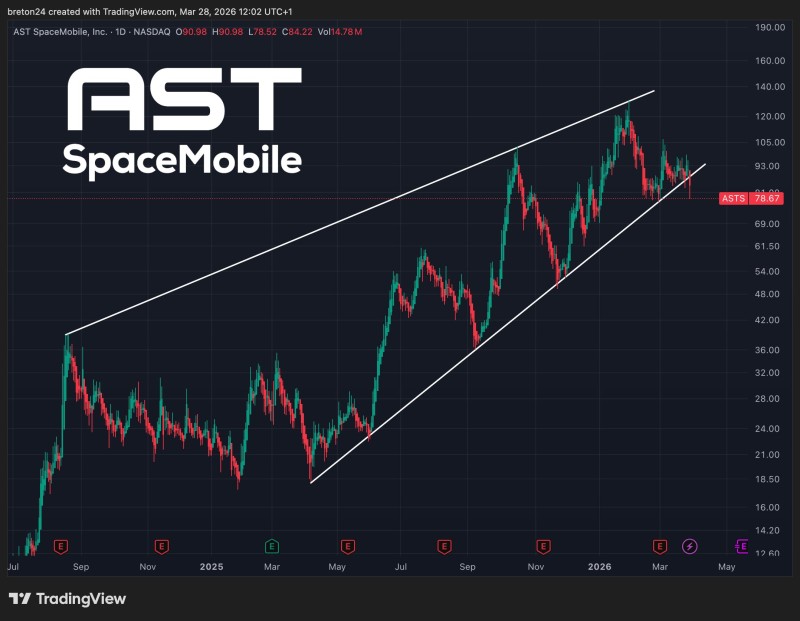
After a strong run through 2025, AST SpaceMobile is showing signs of technical strain. The stock climbed steadily through the year, building a rising structure of higher highs and higher lows - until price action stalled above the $120 level, where multiple attempts to push higher failed. That repeated rejection at the top became the first warning sign that the uptrend was losing steam.
The move that changed the picture came when ASTS closed below the lower boundary of its ascending wedge. StockChaser flagged the breakdown as a clear loss of bullish structure, warning that downside risk increases sharply if the stock fails to reclaim its former support levels. Since then, ASTS has already slipped into the $80 range, with key support levels giving way in the process.
ASTS Wedge Breakdown Puts Bulls on Defense
Price is now hovering near the underside of the broken wedge - a zone that previously acted as support and has since flipped to resistance. This is where the next critical moment plays out. A failed retest of the broken boundary would confirm the breakdown and signal that sellers remain in control.
The breakdown invalidates the prior bullish pattern and suggests the trend has transitioned into a corrective phase.
This sequence - breakdown followed by a weak retest - is a familiar technical setup that tends to produce continued selling rather than a clean reversal. Recent price action reflects exactly that kind of hesitation, with ASTS consolidating within a $75-$95 range and failing to show clear directional strength. The $70-$80 support zone is now the line buyers need to defend.
ASTS Price Target Range Shifts to $50-$60 Support Zone
The chart points toward a potential move into the $50-$60 region if bearish momentum continues. That area aligns with prior consolidation zones and earlier support levels that formed before ASTS launched into its major rally phase. It represents a natural landing spot in the event the current corrective structure extends further.
The sequence of higher lows has been broken, and the stock is no longer supported by its prior rising channel.
With current price action sitting in the high $70s to low $80s, there is still meaningful room to the downside. Broader analyst sentiment has been cautious as well, with average price targets reflecting a bottom formation window rather than an immediate recovery scenario.
What the ASTS Chart Setup Means for Traders
The decisive question now is whether buyers can push ASTS back above the broken wedge boundary or whether the stock confirms the rejection and resumes its move lower.
Unless buyers regain control and push price back above resistance, the current setup favors continued downside pressure.
The technical structure has shifted. The uptrend that defined much of 2025 has given way to a corrective pattern, and without a convincing reclaim of former support levels, the path of least resistance remains to the downside. The wedge breakdown is the defining signal traders are watching - and until it is reversed, the burden of proof sits squarely with the bulls.
 Saad Ullah


