 Sergey Diakov

⬤ AST SpaceMobile has reclaimed its 20-week simple moving average on the weekly chart, a technical indicator often used to track medium-term momentum and trend direction. The key question now is whether ASTS can hold above this moving average in the weeks ahead.
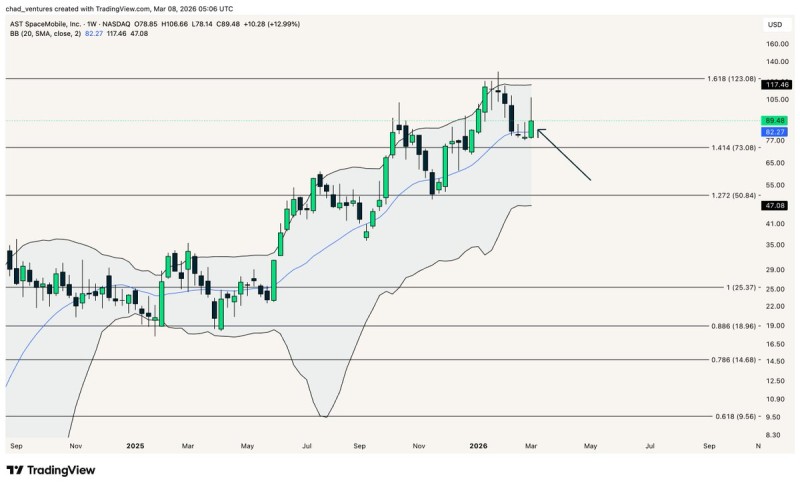
⬤ The stock is trading around the $89 region after bouncing from a recent pullback. Reclaiming the 20-week SMA suggests buyers have regained control at this level. The broader consolidation dynamic has been covered in ASTS Stock Stuck in $75–$95 Range as Breakout Remains Elusive, where mid-$70 support and $90 resistance were identified as the defining boundaries.
⬤ Additional technical structure is visible on the chart: a Fibonacci extension near $73 marks key support, while an extension near $123 represents a potential upside target if momentum returns. Bollinger Bands place ASTS in the upper portion of its volatility range. Prior analysis in ASTS Weekly Chart Shows Calm Structure Despite Heavy Volatility described how the stock tends to consolidate in controlled phases that preserve the broader uptrend.
⬤ Holding the 20-week SMA keeps ASTS within a constructive medium-term structure. A breakdown below this level, however, would signal renewed selling pressure. As outlined in AST SpaceMobile Holds Rising Channel with $1B+ in Contracted Revenue Ahead of Earnings, the stock continues to trade within a broader rising channel despite periodic pullbacks.
⬤ The next phase of the ASTS trend depends on whether the stock can stabilize above the reclaimed moving average. Sustained strength from here would reinforce the broader trend structure, while a failure to hold could push price back into lower support territory.
 Sergey Diakov


