 Artem Voloskovets

⬤ AST SpaceMobile displays a structured weekly chart despite experiencing sharp swings and extended volatility periods. The weekly timeframe shows ASTS holding above its rising trend framework while consolidating near recent highs, demonstrating price discipline within broader market turbulence.
⬤ The chart reveals steady progression through contained pullbacks rather than chaotic movements. Price action respects its broader structure with candles aligned in a smooth, rising formation, indicating volatility unfolds within an organized framework without disrupting the underlying weekly trend.
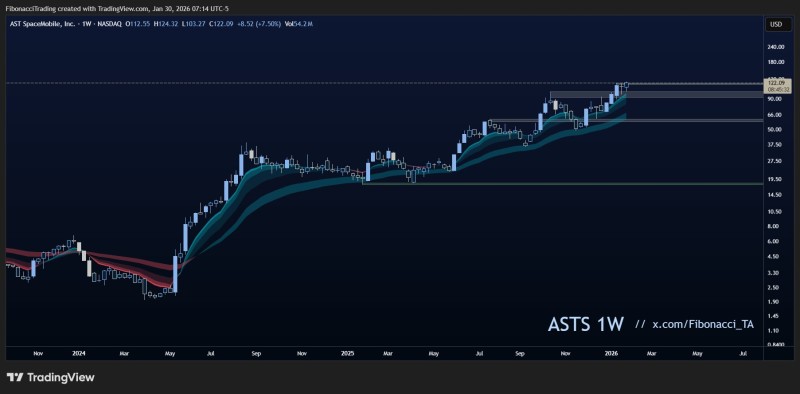
⬤ Technical analysis shows AST SpaceMobile moving through consolidation phases while maintaining structural integrity. Price pauses form controlled ranges instead of sharp breakdowns, keeping the broader trend intact through measured and consistent consolidation periods that reinforce stability beneath surface fluctuations.
⬤ This pattern highlights how prolonged volatility doesn't necessarily signal structural weakness. A stable weekly chart can absorb sharp swings without indicating major directional shifts. ASTS continues trading within its established structure, demonstrating how long-term price organization persists even during heightened volatility periods.
 Artem Voloskovets


