Alex Dudov

Amazon's weekly chart reflects a market that has advanced over time but struggled to sustain clean breakouts. Despite a reported 4.47% CAGR over five years, price action shows persistent friction near key levels - making it genuinely difficult to generate consistent upside. As TrendSpider put it, investors have had to fight for every percent along the way.
A Five-Year AMZN Path Defined by Resistance
The chart compares price behavior around April 2021 and April 2026, and what stands out is how little has changed at the top. In both periods, AMZN stalls around the same horizontal zone near $210 - a long-standing resistance area that keeps reasserting itself.
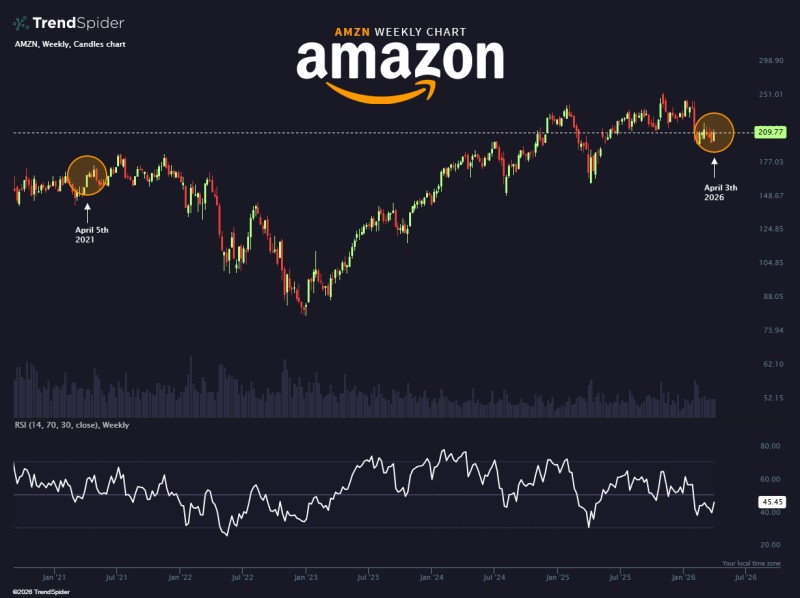
The market trends upward but lacks the sustained momentum needed to break free from familiar ceilings.
This repeated failure to push higher tells a straightforward story: Amazon is moving in the right direction, just not fast enough to satisfy momentum traders.
The $210 Zone That Keeps Capping AMZN Breakouts
Price is currently consolidating just below $210, a level that has acted as a ceiling across multiple market cycles. AMZN has repeatedly faced rejection from this zone, preventing any clean breakout from taking hold.
Sellers continue stepping in near this range, maintaining a structure that keeps the stock bound rather than trending. Even when price pushes toward higher zones like $230-$240, momentum fades before anything sustainable develops - a sign of meaningful overhead supply sitting above current levels.
Every time the stock approaches resistance, the same pattern plays out - sellers step in, rallies fade, and the range holds.
Momentum Reflects a Lack of Conviction
The RSI on the weekly chart sits in the mid-range, avoiding both overbought and oversold extremes. That middle-ground reading isn't neutral in a comforting way - it reflects a market with no strong directional conviction.
Rather than trending decisively, AMZN oscillates between rallies and pullbacks, with momentum consistently fading before reaching extremes. That pattern is typical of a stock stuck between continuation and consolidation - not broken, but not building either.
A Stock That Rewards Patience Over Momentum
The broader structure points to a stock grinding higher without acceleration. Gains have been incremental, interrupted by repeated pauses near resistance. Recent price behavior shows AMZN testing critical support near $211 without establishing a clear directional move - reinforcing the theme of a prolonged consolidation phase.
Key characteristics of the current structure include:
- 4.47% CAGR over five years - positive but unspectacular
- Repeated resistance near $210 across multiple cycles
- RSI holding mid-range with no clear directional bias
- Rallies toward $230-$240 consistently losing steam
- Support near $211 tested but not convincingly held
Long-term direction exists, but progress continues to come slowly - resistance keeps limiting any real expansion to the upside.
For now, Amazon remains a stock where the trend is intact but the pace is frustratingly slow. Until AMZN breaks and holds above $210 with conviction, the same ceiling will likely keep doing its job.
 Alex Dudov