 Artem Voloskovets

AMD is holding near elevated levels after a strong rally, with price now consolidating into a structure that may define its next move. Za notes that the stock appears to be forming a high flag following the move linked to the OpenAI deal, while broader narratives such as CPU demand and agentic AI continue to shape sentiment around the name.
The stock appears to be forming a high flag following the move linked to the OpenAI deal
The AMD Move That Set Up the Flag Pattern
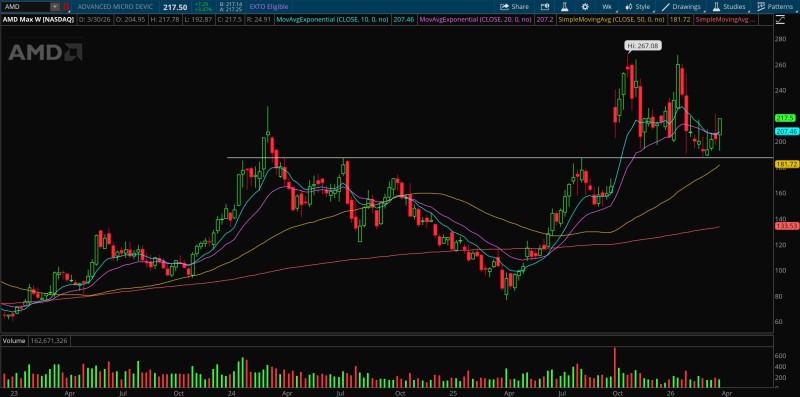
The chart shows AMD rallying sharply into the $260-$270 region before pulling back. This advance established the base for the current structure, with price now trading below the highs but still holding above key moving averages.
The pullback that followed did not lead to a breakdown. Instead, price stabilized and began moving sideways, forming the flag-like consolidation visible in the current setup. This type of behavior - a strong impulse followed by controlled consolidation - is consistent with setups previously observed in AMD, such as AMD Stock News: Strong Uptrend Signals Continued Momentum, where sustained positioning above moving averages supported continuation potential.
Where AMD Price Is Finding Balance Near $200-$215
AMD is currently trading around the $200-$215 region, with price interacting closely with the 10 EMA and 20 EMA. These shorter-term moving averages are flattening, reflecting consolidation rather than directional expansion.
Price is compressing within a defined band, holding above key support while failing to reclaim the peak
Below, the 50-day moving average near the $180 zone remains intact and upward-sloping, providing a broader structural reference. The fact that price remains above this level keeps the overall structure supported despite the pullback. Recent price action also aligns with patterns covered in AMD Stock Holds $205 Support Zone After Rally Above $230, where the stock stabilized around similar levels after a rally - reinforcing the importance of this range as a support area.
AMD High Flag Pattern: Key Levels Traders Are Watching
The high flag referenced in the analysis is visible in the tightening range beneath the recent highs. Rather than expanding lower, price is compressing within a defined band, holding above key support while failing to reclaim the peak. This keeps both outcomes open, but the structure itself reflects a pause rather than a confirmed reversal.
Key levels and technical factors currently in play:
- Rally high in the $260-$270 zone establishing the flag pole
- Consolidation base holding in the $200-$215 range
- 10 EMA and 20 EMA flattening, signaling controlled sideways movement
- 50-day moving average near $180 remaining upward-sloping
- CPU demand and agentic AI narratives continuing to influence sentiment
The next directional shift will depend on whether price resolves this consolidation range with expansion or breakdown
Similar consolidation phases have been observed in AMD's recent technical behavior, including AMD Price: $235-$260 Rally in Sight After $190 Consolidation, where sideways movement preceded directional expansion. For now, the chart shows a market that is holding its structure after a strong move - and the current setup remains defined by the high flag pattern itself.
 Artem Voloskovets


