 Usman Salis

⬤ AMD shares are taking a breather after a strong rally, with the $205 level proving to be a solid floor during pullbacks. This price zone has held up consistently since November, showing that buyers remain active whenever the stock dips to this area. The weekly chart reveals price comfortably sitting above a long-term rising trendline, signaling the broader uptrend stays intact despite some recent back-and-forth action.
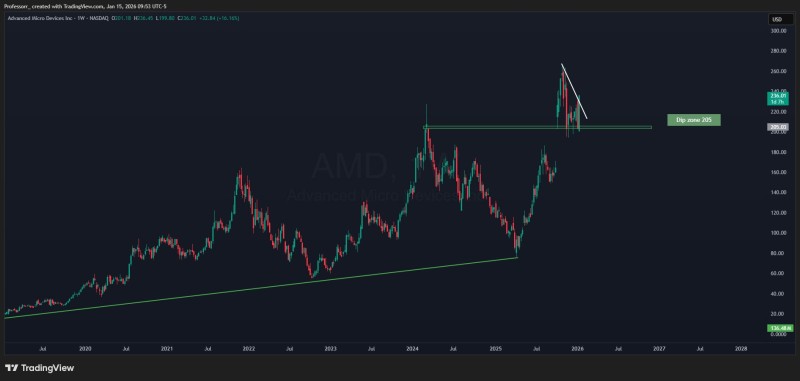
⬤ After pushing above $230, AMD has pulled back but found stability right around the $205 support zone. This level previously acted as resistance before flipping into support—a classic sign you see during healthy uptrends. The area has been tested multiple times over the past couple months without breaking down, which reinforces its importance in the current price structure.
⬤ Looking at the bigger picture, AMD has been moving higher for years within a well-defined upward channel. The chart shows a clear pattern of higher highs and higher lows, all supported by that rising trendline that's been in play through multiple market cycles. While things have cooled off lately, there's no sign of real damage to the structure on the weekly timeframe. This consolidation actually looks pretty normal after such a sharp move up.
⬤ AMD's price action matters beyond just the stock itself—it's a bellwether for the semiconductor sector. The fact that $205 keeps holding shows it's become a critical reference point during this consolidation phase. As long as this zone continues to do its job, the overall trend structure looks solid. Breaking below it would be a different story and signal a shift in technical conditions, but right now the support is holding firm.
 Usman Salis


