Peter Smith

A sharp reversal in capital flows is raising questions about the durability of the recent energy rally. As The Kobeissi Letter reported, global energy funds recorded $2.1 billion in outflows last week - the largest since July 2024 - while XLE saw a $1.0 billion daily withdrawal, the biggest in 14 years. The move follows a powerful three-week surge that brought in $13.5 billion, creating a sharp contrast in short-term positioning.
The XLE Flow Break That Stands Out on the Chart
The chart highlights a clear inflection point. After a strong sequence of inflows, the latest weekly data drops sharply into negative territory - marking the biggest outflow since mid-2024. This shift is visually abrupt: flows that had been consistently building suddenly reversed, breaking the short-term trend in a single week.
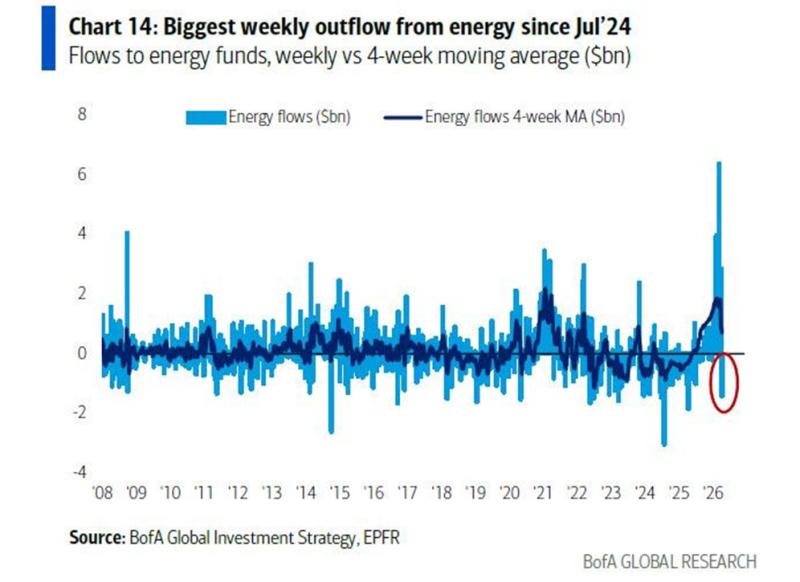
The move stands out historically, with only a handful of comparable downside spikes visible across the dataset. Despite this, the 4-week moving average remains elevated near $1.0 billion - reflecting the strength of the prior inflow cycle and showing that, on a broader basis, capital allocation to energy has not yet fully rolled over.
XLE Oil ETF Allocation Drops 84% to Record Low Despite Resilient Energy Stocks provides longer-term context for how structurally underweight energy positioning has been - making the recent $13.5 billion inflow surge and the subsequent reversal even more significant as a signal of how quickly sentiment can shift in a sector that was already thinly positioned.
A Divergence Between XLE Short-Term Flows and Trend Strength
The structure now shows a clear divergence. Weekly flows have turned negative, but the smoothed trend remains positive due to the recent surge in allocations. The data points reinforce just how extreme the contrast has become:
- Weekly flows dropped to -$2.1 billion
- The 4-week average remains near +$1.0 billion
- Prior inflows reached $13.5 billion over three weeks
- XLE saw a $1.0 billion daily outflow - the largest in 14 years
The 4-week average remains positive because of three weeks of aggressive accumulation - the question now is whether the latest outflow is the beginning of a sustained unwind or a sharp but temporary reset.
Oil Rally at $104.30 Fails to Convince Bond Markets shows how energy price strength has been met with skepticism in other parts of the market - a dynamic consistent with the sudden outflow from energy funds after the three-week inflow surge.
Where XLE Pressure Starts to Build
Large negative spikes of this magnitude have historically marked moments of repositioning rather than routine fluctuations. At the same time, the elevated moving average indicates that investors had built significant exposure into the rally - making the current pullback a first meaningful unwind after an extended accumulation phase.
Oil and Gas Index: Breakout Retest Signals Next Bullish Leg outlines what the price structure needs to do to maintain the bullish case that drove the initial inflow surge - and whether the flow reversal represents a healthy reset or the beginning of a more sustained rotation out of energy.
 Peter Smith