 Saad Ullah
The energy sector is showing a compelling technical pattern. After spending years butting up against a stubborn ceiling, the Oil and Gas index has finally punched through - and more importantly, it's now holding that breakout level as support. This kind of price action has traders wondering if we're witnessing the start of a fresh bullish cycle.
Chart Analysis: From Resistance to Support
The journey to this point has been anything but straightforward. For over a decade, the 130–135 zone acted like a brick wall, rejecting rallies in 2011, 2018, and 2022. Each time the index approached this level, sellers showed up in force, triggering sharp declines. In trader Zafar Shaikh's recent chart study, he highlighted how this persistent barrier has now transformed into a launchpad.
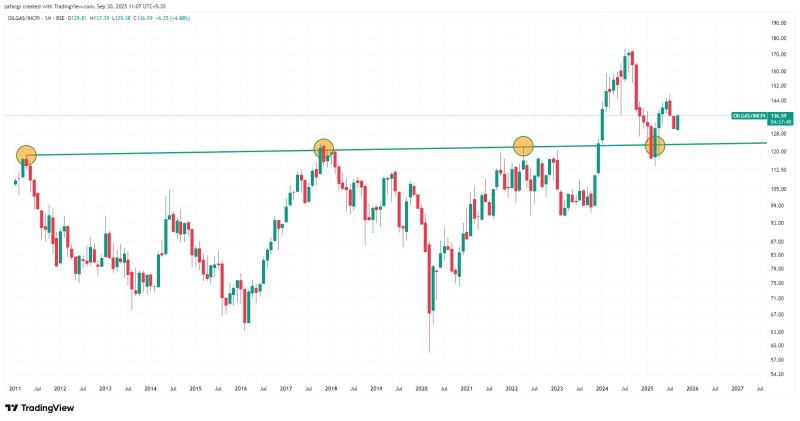
In 2024, the index finally muscled its way above the long-term ceiling, confirming a breakout. Then came the real test: a sharp pullback in 2025 that brought prices right back to that same level. But instead of collapsing, buyers stepped in aggressively, turning old resistance into new support. The index is currently trading near 136.59, sitting comfortably above that critical zone.
This kind of retest is textbook bullish behavior. When a former ceiling becomes a floor, it often sets the stage for the next leg higher. The fact that the index held this level on the pullback suggests there's real conviction behind the move.
Why the Bullish Case Is Building
Several factors are lining up in energy's favor. Global demand is picking up as economies continue to recover, providing fundamental support for the sector. At the same time, commodities like oil and gas are back on investors' radars as hedges against inflation, which remains a concern despite recent cooling. Geopolitical tensions haven't gone away either - ongoing supply risks continue to underpin prices and keep volatility elevated. And from a purely technical standpoint, this setup mirrors patterns that have historically preceded extended uptrends.
What's Next for the Index
The path forward looks promising. If the current momentum holds, the next logical targets sit between 150 and 160, with the possibility of pushing beyond 170 if buying pressure intensifies. Of course, nothing's guaranteed - a decisive break below 130 would throw cold water on the bullish scenario and force a reassessment.
For anyone watching the energy space, the message here is straightforward: the breakout-retest combination suggests the sector may be entering a new growth phase. Whether you're trading energy stocks or tracking commodities, this is a setup worth keeping on your radar.
 Saad Ullah


