 Eseandre Mordi

A subtle but important shift is visible in U.S. monetary data. M2 money supply grew 4.8% year over year in February 2026, reaching a new all-time high of $22.6 trillion. As Econovis noted, the pace of expansion has picked up from recent lows but remains far below the post-pandemic surge - pointing to gradual normalization rather than a new acceleration phase.
The Long-Term Pattern Behind the Current US M2 Move
The chart shows a consistent structure over the past two decades. From 2000 through 2020, M2 growth fluctuated mostly between roughly 3% and 10%, with occasional spikes during stress periods such as the 2008 global financial crisis.
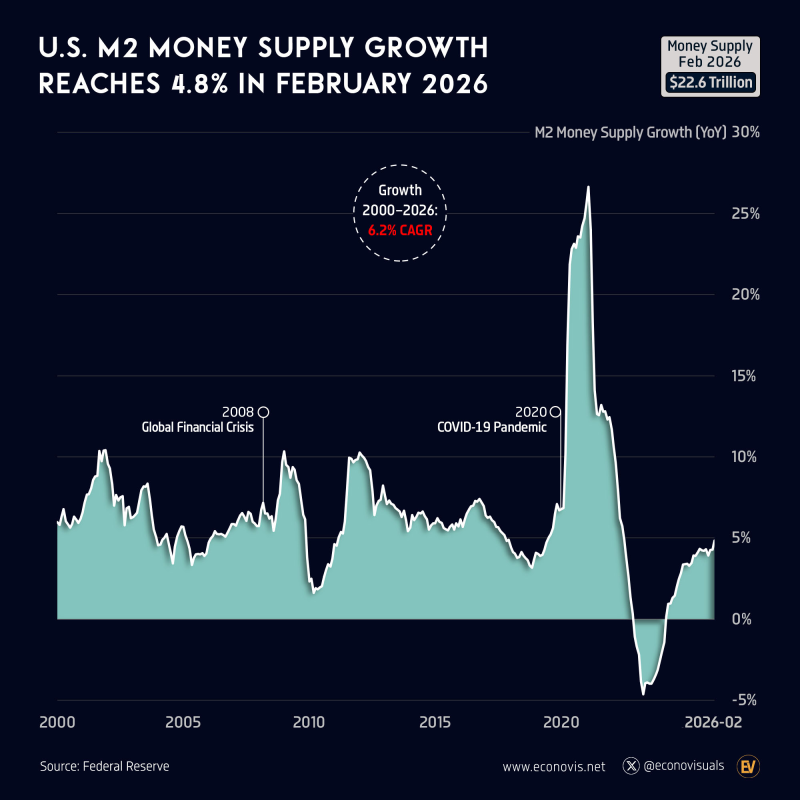
That structure broke sharply during the pandemic. Growth surged above 25%, marking an extreme expansion phase - followed by a rapid decline that pushed M2 growth below 0%, an unusual contraction in modern data. The current recovery to 4.8% places the indicator back within its historical range, suggesting a transition away from extreme volatility toward more typical conditions.
A US M2 Rebound, but Not a Surge
The latest move higher does not resemble the explosive rise seen in 2020-2021. Instead, the chart shows a controlled recovery from the negative trough toward mid-range levels:
- A peak above 25% during the pandemic expansion
- A sharp drop into negative territory after 2022
- A steady rebound back toward the 4-5% range
This progression reflects a normalization phase rather than renewed excess liquidity growth. The slope of the current move is gradual - indicating stabilization rather than acceleration. Global M2 Expansion Returns as US, China, and Europe Push Money Supply Higher shows how this U.S. normalization fits within a synchronized global liquidity recovery, where multiple major economies are moving in the same direction simultaneously.
The M2 Range That Defines the Current Liquidity Phase
The 4-6% area now acts as a key zone within the chart's long-term structure. Historically, this range has represented moderate, steady expansion in money supply - and with M2 growth now at 4.8%, the data sits directly within that band.
U.S. M2 Money Supply Reaches Record $22.3 Trillion in October 2025 provides the earlier milestone that the current $22.6 trillion reading extends - showing how each successive high has been building on a longer-term expansion trend that predates the pandemic spike. US Money Supply Growth Falls Below Golden Rate adds important nuance, emphasizing that even at 4.8%, current growth remains below the historical average that some frameworks use as a benchmark for sustainable monetary expansion.
The broader takeaway from the chart is clear: the contraction phase has ended, and the system is transitioning into a more balanced state of growth - one that supports liquidity conditions without reintroducing the excess that defined 2020-2021.
 Eseandre Mordi


