Alex Dudov

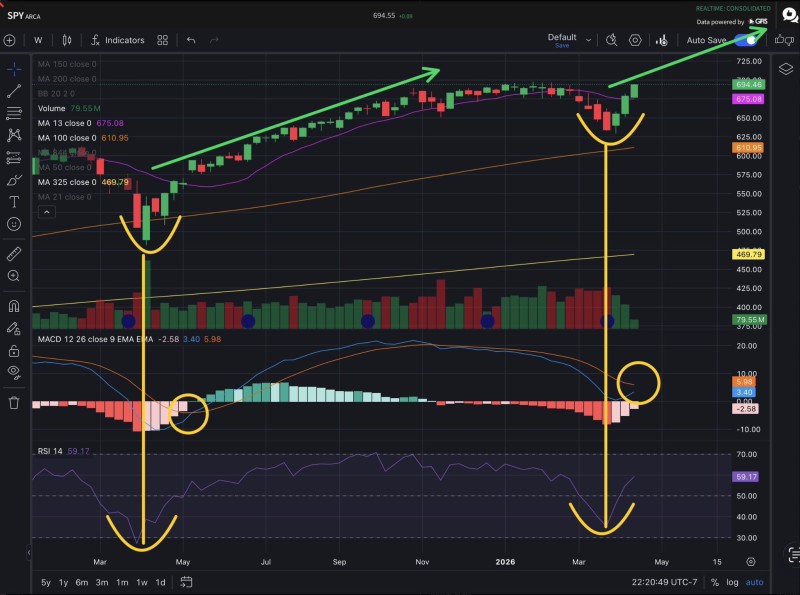
SPY has formed a notable "three white soldiers" pattern on the weekly timeframe - a formation often associated with strong bullish initiation. As highlighted by Banana3, this structure reflects the early stage of a broader upward move rather than a short-lived rally.
While similar patterns on lower timeframes can quickly fail, the same structure on a weekly chart carries significantly more weight.
The recent sequence of strong upward candles follows a rounded bottom formation, suggesting a genuine shift in market direction - one that builds momentum over weeks rather than reacting sharply in short bursts.
A Weekly SPY Formation That Changes the Narrative
The chart emphasizes the importance of timeframe context. What might look like a routine bounce on a daily chart takes on a different character when it appears on the weekly - and that distinction matters for how long any move can last.
This type of setup reflects a slower but more durable transition. Price action that takes multiple weeks to build tends to be harder to reverse quickly, which is part of what makes the current SPY structure worth watching. SPY Climbs Back as S&P 500 Erases 1% Loss showed a similar dynamic, where price regained strength after a pullback before pushing higher.
From SPY Bottom Formation to Trend Initiation
The visual structure shows a clear progression: a prior decline into a base, followed by a steady recovery. The rounded bottom and subsequent upward candles align with the concept of "initiation" - where a new trend begins rather than a temporary rebound fading back into the prior range.
The analysis explicitly contrasts this move with a relief rally, which typically fades and resumes the downtrend. Here, the weekly structure is interpreted as something different - price is not just bouncing, it is beginning to reclaim territory in a way consistent with a new phase. SPY Stock Tests 200DMA at $662 as Buyers Step In With Rising Volume captured a similar moment earlier, where rising volume confirmed buyer interest at a key level.
SPY Targets Extend Toward 7,500 and 8,000 on the S&P 500
The outlook presented in the chart points toward significantly higher S&P 500 levels, with projected targets around 7,500 and 8,000. These projections are based on the strength of the weekly formation and the broader structure now unfolding. No outcome is guaranteed, but the combination of pattern quality and higher timeframe confirmation adds weight to the bullish case.
SPY is not just recovering, but potentially entering a new phase of upward expansion as the weekly pattern continues to develop.
Comparable technical setups have been observed previously - for example, in SPY Prints Bullish Engulfing Candle but Stalls at 200-Day Moving Average, where price interacted with a key level before continuation attempts. The current weekly formation suggests that SPY may be setting the foundation for a more sustained move higher.
 Alex Dudov