 Marina Lyubimova
A long-term technical signal is coming back into focus as the S&P 500 drifts away from recent highs toward a key moving average that has repeatedly defined past market lows. As Mister Crypto noted, the 3-year simple moving average currently sits near $5,580 - and historically, this is exactly where S&P 500 corrections have found their floor. The setup places SPY stock at a critical inflection point where historical behavior suggests a decisive reaction may follow.
The S&P 500 has always bottomed around the 3-year SMA. Right now that level sits near 5,580 - and the market is heading straight for it.
A Repeating S&P 500 Pattern Along the 3-Year SMA
The chart shows a sustained multi-year uptrend in the S&P 500, with price consistently respecting the 3-year simple moving average as dynamic support. Multiple prior corrections - including those around 2011, 2016, 2018, 2020, and 2022 - all found a bottom near this rising trendline before resuming higher.
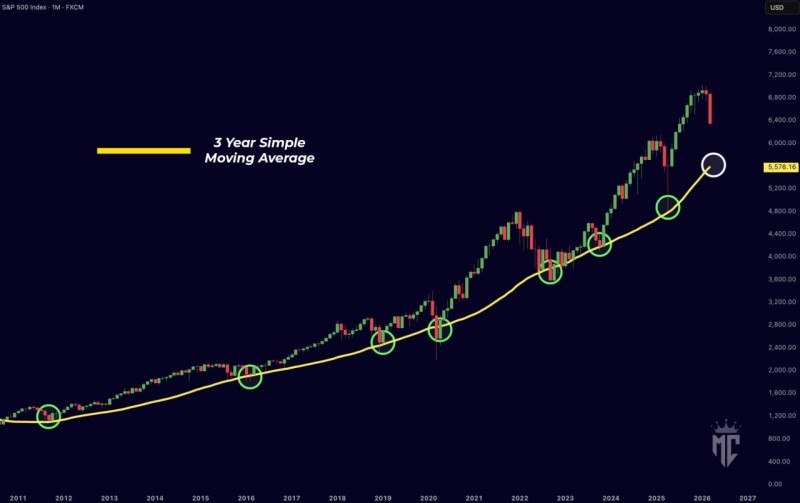
Unlike shorter-term indicators such as the 200-day moving average, this longer-term average captures broader cycle behavior, making it a key reference point in long-term technical analysis of the stock market trend. Each touch of this level has historically coincided with strong reversals, marking key accumulation zones during previous cycles.
SPY Structure After a Parabolic Advance
Recent price action shows the S&P 500 climbing sharply into new highs before printing a clear rejection. The latest move introduces downside pressure, with the first meaningful pullback after an extended rally phase. Structurally, the trend remains intact on a macro level - but short-term weakness is now evident:
- The rally into highs has stalled
- Price is moving lower in a corrective phase
- The index is gradually approaching long-term support
This aligns with broader observations that the S&P 500 is experiencing short-term weakness while still holding within a larger bullish structure.
The current pullback doesn't break the long-term structure - it's testing it. Every prior correction that touched the 3-year SMA produced a higher low. That pattern is still very much alive.
Where the S&P 500 Has Turned Before
The repeated interactions with the 3-year SMA form the core signal in this setup. Each dip into the moving average has produced a higher low, reinforcing the long-term uptrend. Now, with price positioned above but moving toward the same level again, the market is approaching a zone that has consistently defined prior bottoms.
The chart highlights these moments clearly - 2011, 2016, 2018, 2020, 2022 - every one of them a buying opportunity in hindsight. The question now is whether $5,580 becomes the next entry on that list. Traders watching SPY pullback levels and Elliott Wave structure will be closely monitoring whether this key average holds once again.
Five times in the last 15 years, the 3-year SMA stopped a correction cold. This is not a coincidence - it's the market finding value at the same structural level, cycle after cycle.
A Level That Extends Beyond SPY Equities
The analysis also points to a broader implication: if the S&P 500 were to decline toward $5,580, it could coincide with broader risk-off conditions across markets. While the chart focuses strictly on price structure, the implication is clear - this level is not just technical, but also tied to sentiment shifts across risk assets. A break below it, should it occur, would carry a very different message than a bounce.
 Marina Lyubimova


