 Sergey Diakov
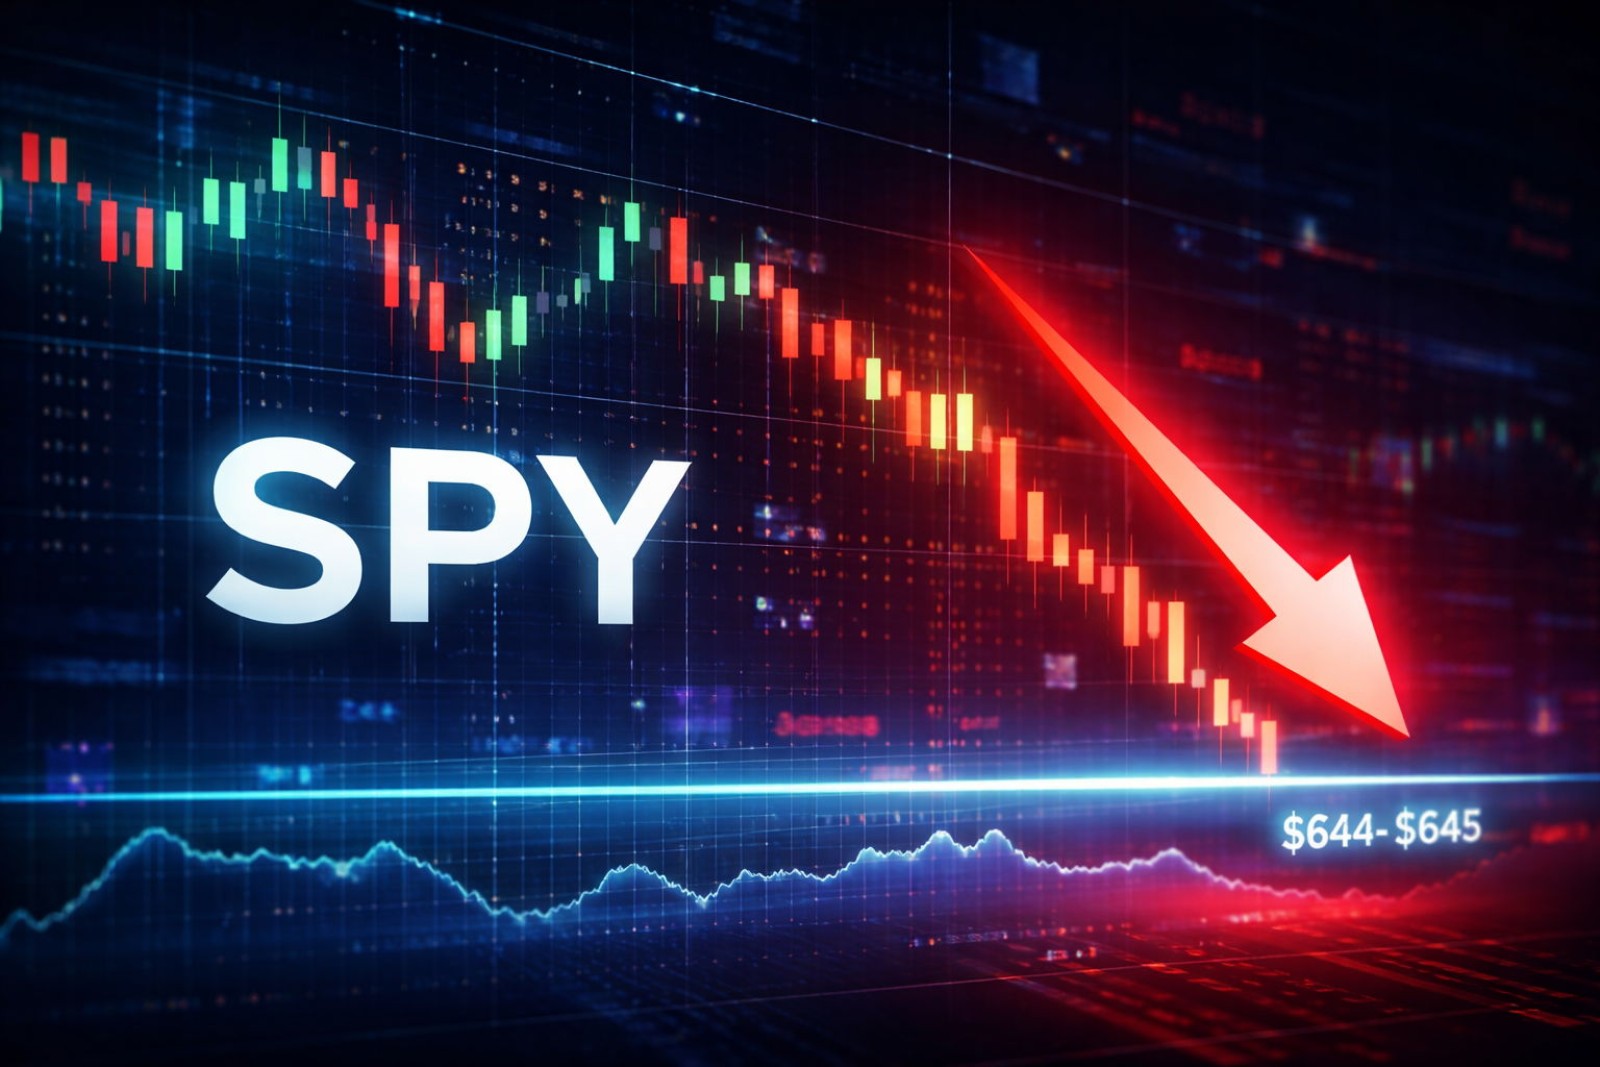
The S&P 500, tracked by SPY, is moving into a technically fragile phase as price compresses near a critical support zone. As Danny cheng pointed out, two "volatility holes" that previously anticipated sharp moves are now aligning with current downside pressure - putting the SPY Stock Tests $646 Support as 50-Week SMA Faces Breakdown Risk zone squarely in the spotlight.
How SPY Lost Its Bullish Structure
The shift from strength to deterioration has been gradual but clear. After peaking, SPY started printing lower highs while drifting beneath a descending dynamic resistance - a classic sign that bulls are losing control of the tape.
Price is no longer holding prior value areas and has rotated into thinner liquidity. Every bounce gets sold earlier than the last, which tells you sellers are getting more aggressive, not less.
Those same signals are now aligning with current downside pressure - putting the $644-$645 region in focus as a potential inflection point.
What makes this setup more concerning is the nature of the decline. This isn't a sharp capitulation - it's a controlled, grinding drop. In technical analysis, that type of move tends to be more persistent and harder to reverse than a sudden flush.
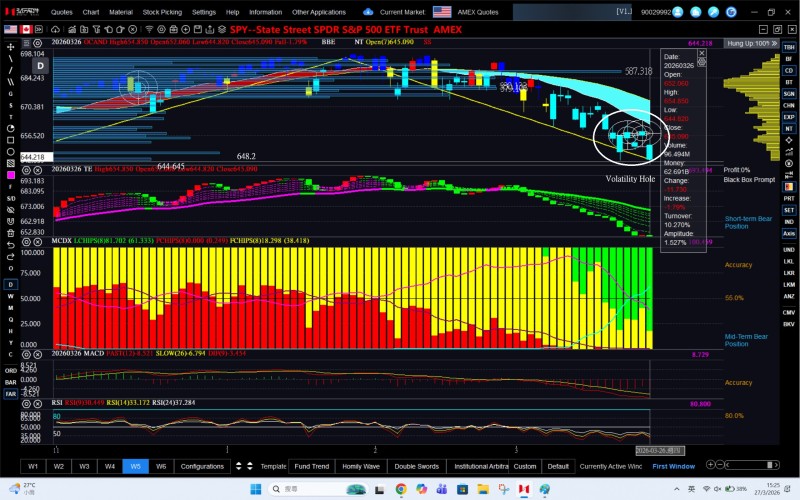
Why the 2 Volatility Holes Matter for SPY
One of the most telling features on the chart is a pair of "volatility holes" - areas where price moved quickly through thin resistance. These zones act as pathways rather than barriers, and both gaps accurately preceded high-volatility moves in recent sessions.
Compression near support often precedes decisive moves rather than sustained stabilization.
The current interaction with a similar zone means the market remains vulnerable to sudden directional expansion. Traders watching SPY Inverse Head & Shoulders Forms, Eyes 680 Level patterns will recognize this kind of setup - it rarely resolves quietly.
The $644-$645 Zone: 3 Signals That Suggest It Won't Hold
The highlighted support range isn't a random level. It aligns with prior price reactions and sits near a key structural floor - but the behavior around it raises red flags:
- Lower highs keep pressing into support from above
- RSI in the low range reflects weak demand, not a recovery
- Price remains below key trend structures and value areas
The candles show hesitation rather than strong rejection, indicating that buyers are not aggressively defending the level.
Candles are showing hesitation, not strong rejection. Buyers simply aren't stepping up with conviction. As covered in the S&P 500 Signals Correction After 6,900-7,000 Peak analysis, prolonged compression near support tends to weaken it over time. Unless SPY can reclaim higher levels and break the pattern of lower highs, the path of least resistance still points lower. The $644-$645 zone may offer a temporary pause - but structurally, the market looks like it's still searching for a more durable base.
 Sergey Diakov


