 Eseandre Mordi

One level is defining the entire SPY setup right now: $646. That's where the weekly 50 SMA sits, and that's where price keeps returning without making a clean decision in either direction. The longer it stays there without bouncing, the more that indecision starts to look like a problem.
Professional Trader/Investor flagged the setup, and the structure is hard to argue with. SPY is holding around $646.20, but the candles clustering at this level aren't the kind of tight consolidation that typically precedes a strong bounce. They look more like buyers defending a line they're not entirely sure will hold.
SPY Stock at $646: 50-Week SMA Under Pressure as Lower Highs Form
The context matters here. SPY pushed higher into early 2026, then started forming lower highs. That sequence, lower highs pressing into the same support level, is one of the more reliable warning signs in technical analysis. It means sellers are getting more aggressive at lower prices while buyers haven't stepped up with any real conviction.
Holding this level could act as a launchpad for higher prices, but failure to hold shifts focus toward lower demand zones across both daily and weekly timeframes.
The momentum indicators back this up. MACD is expanding lower. RSI is sitting in the low-40 range, which is bearish pressure territory without being oversold yet. That last part matters: there's still room to fall before the market looks stretched to the downside.
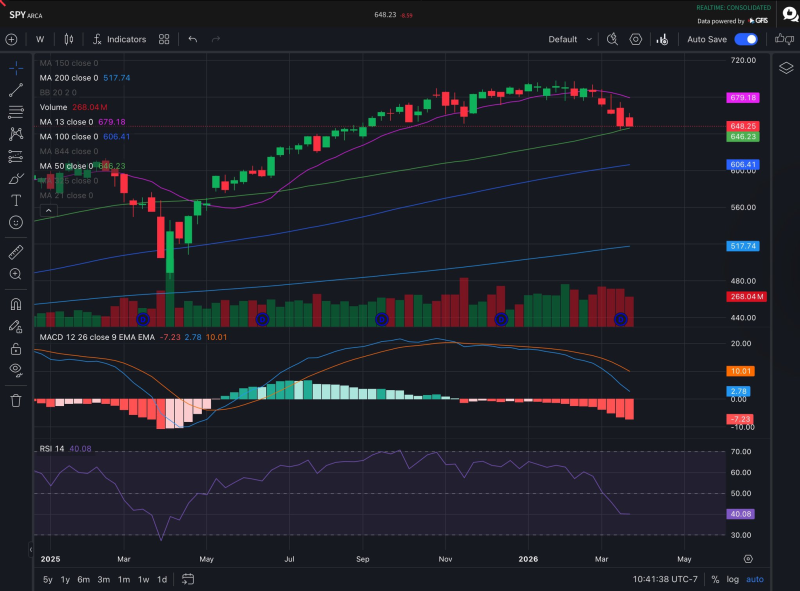
SPY has already been compressing below its 200-day MA near $661, which means the 50-week SMA at $646 is now the last meaningful line before the structure shifts more seriously.
SPY Stock Breakdown Below $646 Opens Path Toward $630 Support Zone
If $646 gives way, the next reference point is around $630, where the 100-week SMA sits alongside prior consolidation across multiple timeframes. That overlap between a major moving average and an older demand zone makes it a more significant level than either would be on its own.
The move toward the 100-week SMA is not guaranteed, and price may react before reaching it, but structurally the setup points lower if $646 fails to hold.
That said, levels don't work like magnets. A breakdown doesn't guarantee a full move to $630, and price could find support at any point along the way. What changes is the bias: once the 50-week SMA breaks, the burden of proof shifts to the bulls.
- Price forming lower highs into the same support
- MACD expanding lower, RSI in low-40s
- 50-week SMA at $646.20 being tested repeatedly
- 100-week SMA near $630 as next major demand zone
- No confirmed breakdown yet, but no clean bounce either
SPY previously showed an inverse head and shoulders pattern targeting $680, which makes the current compression all the more notable. That bullish setup loses credibility the longer price stays pinned below key resistance levels.
SPY Stock Inflection Point: Compression Phase Typically Resolves Fast
That's the nature of compression. Price can grind along a support level for a while, but the longer it does, the more energy builds on one side. Right now that energy looks tilted downward, with lower highs pressing into $646 while momentum continues to fade.
The $657 level, where the 200-day MA previously acted as resistance, is now well overhead. Reclaiming that level would be the first real sign that bulls are back in control. Until then, $646 is the line that matters.
Support is still intact. But the structure around it keeps getting thinner.
 Eseandre Mordi


