 Saad Ullah
The S&P 500 is flashing early signs of a corrective phase after topping out near the 6,900-7,000 zone in late January 2026, following a sharp rally from the April 2025 low. Price has since retreated toward the mid-6,500 area. According to S&P 500 Stalls at 6,670 as Correction Scenario Builds, fading momentum had already been pointing to potential downside continuation before the peak was confirmed.
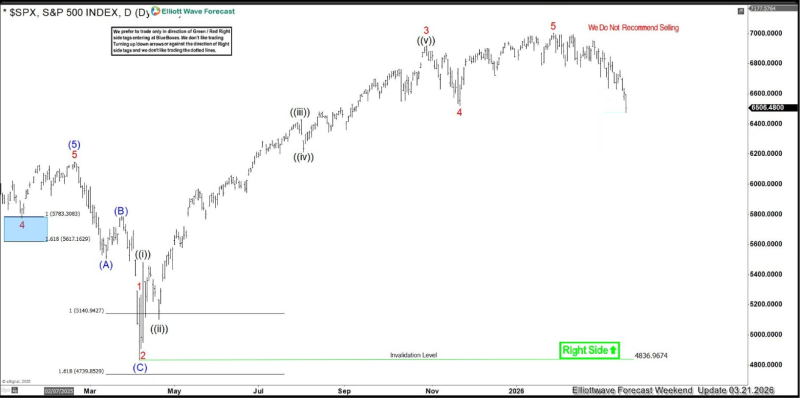
⬤ Elliott Wave analysis presented by Elliottwave Forecast points to a completed five-wave structure into the highs, with wave (5) now finished and a corrective sequence underway. The projected pullback is expected to develop across 3, 7, or 11 swings - a typical pattern for complex corrections - while the broader bullish trend holds intact above the key invalidation level near 4,836.
⬤ Price action is behaving in line with the Elliott Wave playbook: wait for extreme zones before re-entry rather than chasing pullbacks. Similar setups have played out recently - SPY Pullback Hits Support at $678 as Elliott Wave Structure Holds and SPY Faces $657 200-Day MA Test as 8-Day EMA Rejections Mount both saw pullbacks resolve as continuation structures within a larger uptrend.
⬤ The current SPX correction marks a transitional window where volatility may pick up as the market hunts for support. Multi-swing pullbacks like this are a normal feature of extended bull cycles - they reset momentum without breaking the larger trend. How this structure resolves will determine whether the index resumes its climb or slides into a deeper consolidation, with broad market sentiment hanging in the balance over the coming months.
 Saad Ullah


