 Saad Ullah

⬤ SPY's sitting pretty above what used to be a brick wall for price action, and it's not just hanging on by a thread—it's actually settling in. The daily chart tells the story: after finally punching through that stubborn ceiling, the ETF isn't collapsing back down like we've seen so many times before. Instead, volume's backing up the move, which means traders aren't second-guessing these levels. Raindrop volume analysis shows serious buying interest locked in above that old resistance zone.
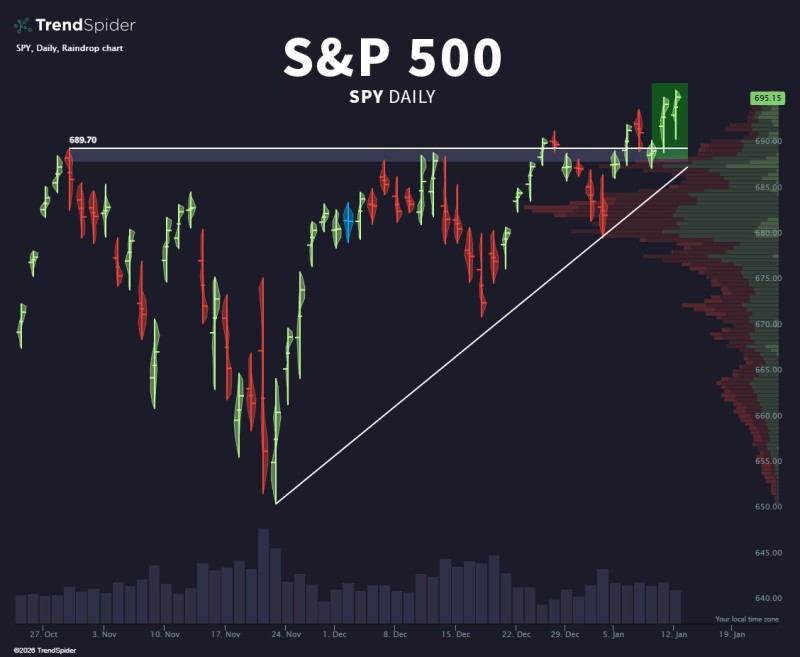
⬤ Looking at the chart, SPY's consolidating between $689 and $695—the same area where previous rallies died out. But this time? Different story. Price isn't getting rejected. Instead, we're seeing higher lows stacking up along a rising trendline that started back in late November. The volume profile on the right side of the chart shows concentrated activity above that former resistance, which basically means buyers are stepping in to defend this territory.
⬤ The raindrop volume metrics back this up by showing heavy participation clustered in those recent candles. When price and volume agree like this, it usually means sellers are backing off and confidence is building. Pullbacks have been shallow, and there's no sign of heavy selling pressure. That tells us supply's getting absorbed at these higher levels without much drama.
⬤ This matters because SPY is basically the temperature check for the entire U.S. stock market. When it holds above old resistance with solid volume, that keeps momentum going and gives traders confidence to stay in risk-on mode across different sectors. That said, this zone's now the line in the sand—if volume support breaks down here, sentiment could shift fast. Right now though, the S&P 500's in a technically strong spot with volume confirming the uptrend is legit.
 Saad Ullah


