 Eseandre Mordi

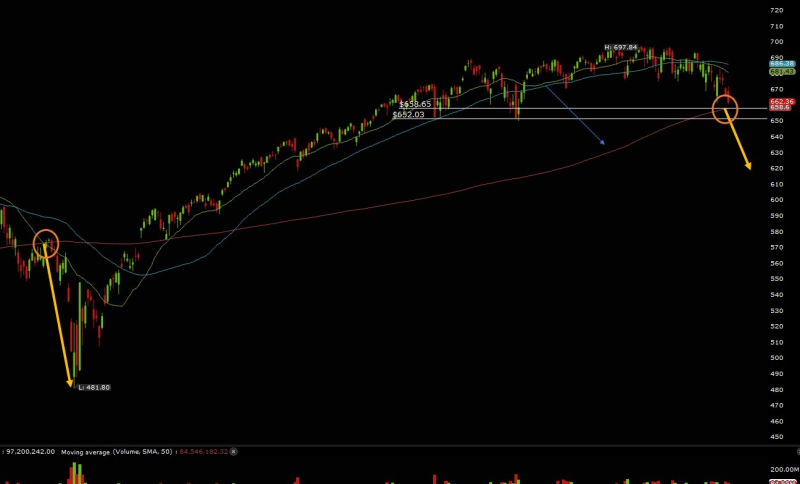
The SPDR S&P 500 ETF (SPY) has closed below its 200-day simple moving average, joining a very short list of historical moments when this key technical line gave way. The latest breach was driven by trade-related volatility that pushed SPY toward the $481 area, raising a familiar question among long-term investors: is this a crisis, or just another test the market eventually passes?
5 Times SPY Broke Below the 200-Day SMA
The record is worth taking seriously. During the dot-com collapse between 2000 and 2003, SPY shed roughly 49% after losing the 200-day SMA. Once it reclaimed that level, the index posted a 33% one-year return. The Global Financial Crisis brought an even steeper 57% drawdown from 2008 into mid-2009, followed by a 45% recovery in the year after the trend line was regained.
From the 2011 Debt Crisis to COVID: The Same Pattern, Repeated
Shorter disruptions followed the same script. The 2011 U.S. credit downgrade and European debt crisis dragged SPY below the indicator for several months before a 27% rebound unfolded. The COVID shock of early 2020 produced the fastest and sharpest break, a roughly 34% drop in weeks, before equities reversed just as aggressively. More recently, the 2022 Fed rate-hike cycle pushed SPY about 25% below the trend, with stabilization coming only after the hiking pace slowed.
Each of these episodes initially looked like the beginning of something worse. Each eventually resolved with the market reclaiming the 200-day SMA and pushing higher. The current tariff-driven pullback has triggered the same signal, and while the macro backdrop is different each time, the structural behavior of SPY around this indicator has been remarkably consistent. History does not guarantee a repeat, but it does suggest that the 200-day SMA is worth watching closely as a potential turning point.
 Eseandre Mordi


