 Eseandre Mordi

⬤ The S&P 500 is flashing early warning signs after months of relentless gains that brought the index close to record territory. Price has begun to stall around the 6,670 zone, and technical readings are softening in a way that suggests the broader market correction may not be over yet.
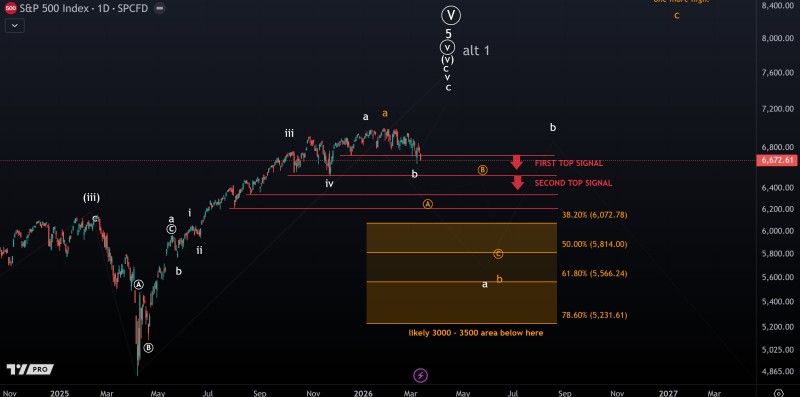
⬤ The Elliott Wave structure on the chart points to a potential topping phase, with two resistance zones identified as "first top signal" and "second top signal." Fibonacci retracement levels below current price sit at roughly 6,072 (38.2%), 5,814 (50%), and 5,566 (61.8%) - each a plausible landing spot if selling picks up. The setup echoes warnings already flagged in SPX Pulls Back From 7000 as Geopolitical Risks Resurface, where geopolitical noise added fuel to the technical case for a pullback.
⬤ Beneath the surface, the damage is already visible. Dozens of stocks inside the benchmark have quietly dropped 7% or more even while the headline index holds near highs - a divergence that rarely ends well, as detailed in 115+ S&P 500 Stocks Crashed 7% While SPY Trades Near Record Highs. When market breadth deteriorates this way, it usually signals the index itself is next.
⬤ The long-term uptrend stays intact, but corrective phases are a natural part of any extended bull run. Valuations stretched, indicators softening, and breadth rolling over - those three together have historically preceded meaningful retracements. Whether the current weakness deepens into a full pullback or simply consolidates before the next leg depends on how price behaves around the current resistance zone. More context on the bigger cycle sits in SPY Cycle Watch: S&P 500 ETF Approaches End of 17-Year Bull Phase.
 Eseandre Mordi


