 Eseandre Mordi

⬤ SPY is back in focus as a familiar technical signal resurfaces on the chart. As Mike Investing noted, this same pattern has shown up several times since 2022 following strong rallies, each time leading to a meaningful pullback. The chart shows a repeated cycle: the index forms a local top, then retraces toward prior resistance zones, laying the groundwork for the current bearish read.
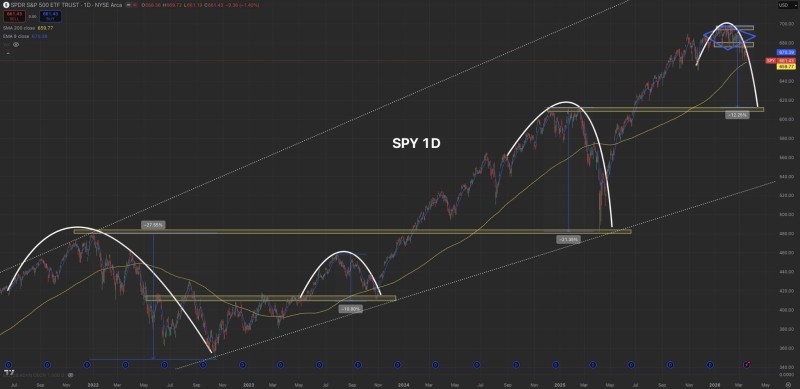
⬤ The key trigger is the weekly 9 EMA crossing below the 21 EMA, a move that has historically kicked off declines of 10% or more. Past drawdowns on the chart came in at roughly -27.5%, -10.8%, and -21.3%, each one snapping back to a prior breakout level. Right now, the projected target sits near $612, implying about a -12% drop from recent highs in the $690-700 range. A recent SPY pullback to key support near $678 already fits this corrective pattern.
Similar setups have occurred multiple times since 2022 following major rallies, each leading to notable pullbacks.
⬤ Daily price action adds weight to the case, with a rounded top forming and momentum fading near resistance. SPY is also hovering around its 200-day moving average in the mid-$650s, a zone that often marks broader trend shifts. Under the surface, conditions are deteriorating: the S&P 500 volatility gap hitting a 25-year extreme signals growing dispersion even as headline index levels look calm.
⬤ The longer-term trend is still upward, but history shows these setups tend to trigger mean reversion phases rather than full reversals. Prior research has also flagged that SPY corrections are often part of broader cycle turning points, making it worth watching technical signals closely when the index is extended.
 Eseandre Mordi


