Usman Salis

Data covering two decades of S&P 500 performance suggests the index has often touched its annual low right around March 12, before turning higher for the rest of the year.
20 Years of Data Point to a Mid-March Turning Point
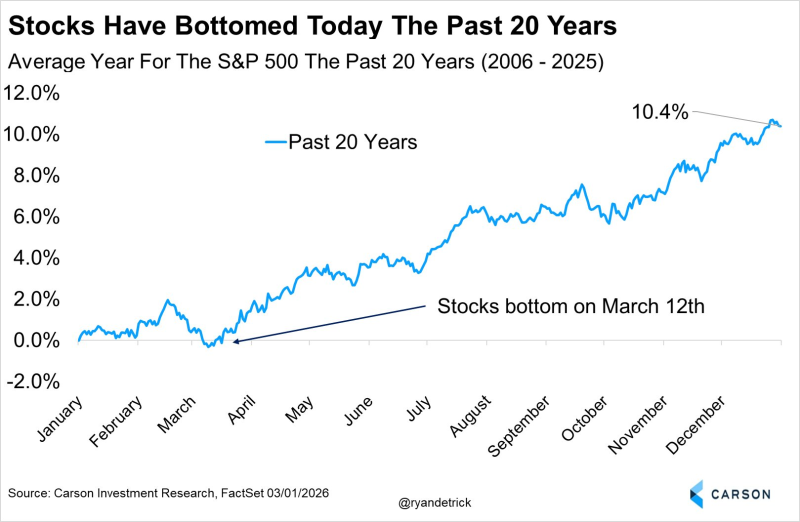
A long-term seasonal chart compiled by Carson Investment Research using FactSet data has resurfaced in market discussions, drawing attention to a recurring pattern in the S&P 500 (SPX). Covering the period from 2006 to 2025, the chart maps the index's average annual trajectory - and the low point lands squarely around March 12.
The repeated appearance of a mid-March low in the S&P 500 highlights how calendar-based patterns can shape expectations about the broader trajectory of U.S. equities.
Early in the year, the average path shows modest choppiness before stabilizing in mid-March. After that, the S&P 500 SPX broadening formation pattern analysis suggests the index typically moves into a steadier recovery phase through summer and into year-end.
Average Annual Gain of 10.4% Follows the Seasonal Low
According to the seasonal chart, the S&P 500's average annual performance climbs to roughly 10.4% by December - measured from the start of the year. That trajectory, from mid-March trough to year-end, reflects a historically reliable upward drift once early-year volatility clears.
Analysts who track seasonal equity behavior note that while individual years can diverge sharply from averages, the March pattern has shown up often enough to be considered meaningful. Sentiment-driven selling in the first quarter, tax-related flows, and positioning adjustments all likely contribute to the recurring dip.
Seasonal data like this doesn't predict the future - but it does offer context. For investors trying to read where the S&P 500 stands relative to its historical rhythm, mid-March represents a point worth watching closely each year.
 Usman Salis