 Saad Ullah

⬤ The NASDAQ index has entered a sharp downward move after heavy selling wiped out gains from around 25,100, pushing the benchmark toward the 24,000 region. The hourly chart shows a modest reaction bounce from the lower part of the Fibonacci retracement band near the 0.236 level, though the overall structure still reflects a weak recovery attempt with short-term selling pressure firmly in control.
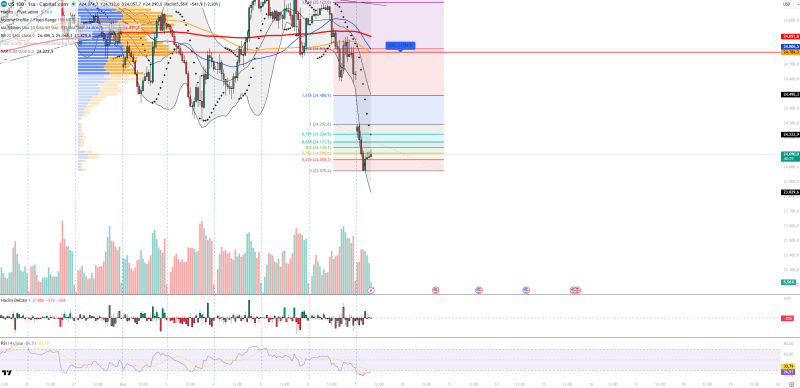
⬤ Technical indicators reinforce the severity of the decline. The RSI has dropped to around 26, placing the index firmly in oversold territory and signaling strong bearish momentum. Trading volume has picked up notably on down candles, confirming broad selling participation. Volume Profile analysis flags the 24,784 zone as the Point of Control and a key resistance level should the market attempt a recovery.
⬤ Additional signals add to the bearish picture. Volume Delta continues to reflect persistent selling, suggesting sellers still dominate short-term flows. Bollinger Bands show price pressing against the lower band, which typically accompanies strong downward momentum, while Parabolic SAR dots positioned above price confirm the ongoing downtrend. Immediate support sits at 24,090, 23,975, 23,829, and 23,600. Resistance levels stand at 24,224, 24,495, 24,784, and 25,123. Earlier analysis of US100 below 25,032 resistance had already pointed to rising selling pressure as the index struggled below key levels.
⬤ The macroeconomic backdrop is adding extra weight on sentiment. Rising oil prices and escalating geopolitical tensions are pushing inflation expectations higher across global markets. Elevated energy costs increase the likelihood that interest rates stay higher for longer, which typically pressures growth and technology-heavy indexes like the NASDAQ more than most. The combination of macro headwinds and deteriorating technicals keeps the short-term outlook skewed to the downside as the index tests critical support around the 24,000 mark.
 Saad Ullah


