 Saad Ullah

⬤ The US100 NASDAQ benchmark took a beating on the hourly chart after getting rejected at a strong resistance area and sliding straight into a marked support zone. The short-term downtrend is unmistakable, with only a weak bounce forming near the lower volatility band after the selloff. The move keeps price stuck below overhead levels while sellers call the shots.
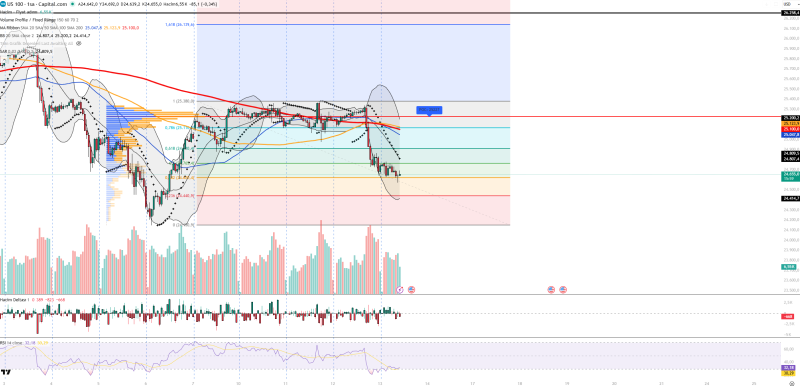
⬤ Chart indicators are painting a bearish picture. RSI is hovering around 30 to 32, putting NASDAQ near oversold territory without showing any real signs of a sustained rebound. Volume spiked during the decline but the reaction has been muted, while volume delta stays negative—proof that selling pressure still outweighs buying interest. The volume profile POC sits near 25.227, creating a strong resistance zone above current price, and Parabolic SAR remains above the candles, keeping the downtrend alive.
⬤ Key levels to watch: supports at 24.655, 24.414, and 24.149, with resistance at 25.048, 25.100, and 25.200. Similar support test setups were recently discussed in NASDAQ futures coverage.
⬤ This move matters because NASDAQ weakness is tied to US interest rate expectations and fading risk appetite toward tech stocks. If those headwinds stick around, rallies may continue to struggle below the 25.2K resistance cluster, leaving the index vulnerable to further support retests. Related coverage on tech stock pressure can be found in recent market analysis.
 Saad Ullah


