Sergey Diakov

NASDAQ continues to trade above the key 25,000 level after a strong upward move, with price now compressing in a tight range just below resistance. The current structure reflects a continuation setup, where consolidation is forming within an ongoing uptrend. As Forex Sinyal Merkezi noted, this positioning supports a continuation formation rather than a reversal.
The NASDAQ Move Above 25,000 That Changed Structure
The chart shows a clear breakout above 25,000, followed by a controlled consolidation phase between 25,300 and 25,600. This range reflects a horizontal compression after the recent upward move, consistent with a flag-like continuation structure.
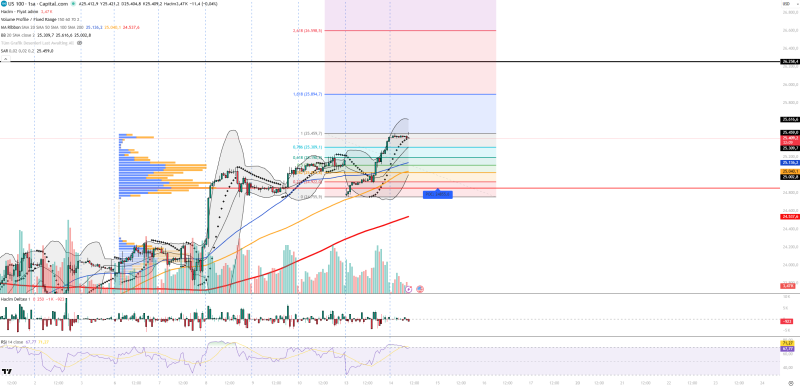
Price remains above all key moving averages and close to the upper Bollinger Band, reinforcing the strength of the trend. NASDAQ Breakout: US100 Surges Past 25000 as Momentum Indicators Flash Caution covered the initial phase of this move in detail.
NASDAQ Momentum Signals Stay Strong
Indicator readings from the chart confirm sustained bullish pressure:
- RSI is in the 67-71 range, showing strong momentum but approaching overbought territory
- Volume is increasing with the upward move, indicating buyer support
- Volume delta remains positive, confirming buyers are dominant
- Price is near the upper Bollinger Band, reflecting strong momentum
- Parabolic SAR remains below price, signaling continuation of the uptrend
RSI sitting in the 67-71 range alongside a positive volume delta points to buyers staying in control - but the market is close enough to overbought territory that caution is warranted.
This alignment suggests the trend remains intact, though the market is approaching a zone where short-term reactions can occur.
The NASDAQ Range Defining the Next Move
The consolidation zone between 25,300 and 25,600 is now the key structure on the chart. The resolution of this range will likely define the next directional move.
Above, resistance levels are positioned at 25,600, followed by 25,900, 26,250, and 26,600. Below, support levels are layered at 25,300, 25,040, 24,855, and 24,530, with the volume profile point of control near 24,855 acting as a strong equilibrium zone. NASDAQ Stalls Below 25000 as Volatility Squeeze Builds provides useful context on how this index behaved just ahead of the current breakout.
Compression Near Highs Signals Ongoing Pressure
The current structure reflects consolidation near highs rather than weakness. Price continues to hold above key levels while compressing under resistance, suggesting sustained upward pressure.
When price compresses near highs rather than pulling back aggressively, it typically reflects a market that is pausing to build energy rather than topping out.
NASDAQ Price Analysis: Index Tests Key 25,000 Resistance After Rebound From 24,500 tracked the same zone from a slightly different angle, offering additional perspective on how this level has developed over time.
 Sergey Diakov