 Usman Salis

The NASDAQ (US100) has bounced back from the 24,500 low and is now pushing toward the 24,900 region, holding inside a short-term ascending channel. The 24,950 to 25,000 zone has become the main resistance to watch, and as long as price stays above 24,750, the bullish structure remains in play. Full technical breakdown is available at Technical NASDAQ hourly analysis.
Momentum Indicators Signal Cautious Optimism
Momentum is picking up but not flashing any warning signs yet. The RSI sits around 57, which reflects neutral-to-positive strength without pushing into overbought territory.
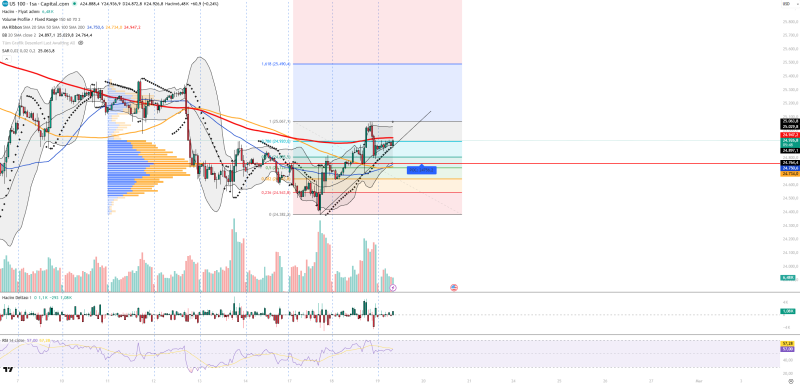
Price is trading near the middle-to-upper Bollinger Band, pointing to upward pressure, and the Parabolic SAR is still in bullish alignment. Volume is participating in the move, though order flow remains fairly balanced with no clear dominant side.
Key Support and Resistance Levels to Watch
The volume profile puts the Point of Control at 24,756, which is the most important short-term support. Below that, 24,734 and 24,660 offer additional floors. On the upside, resistance sits at 24,947, then 25,063, and further out at 25,250. Past consolidation setups were covered in NASDAQ resistance compression pattern and NASDAQ breakout structure analysis, while recent dips were discussed in US100 support zone reaction.
The bigger picture for NASDAQ still depends heavily on interest rate expectations and tech sector sentiment. Lower bond yields could keep the rally going, while stronger macro data might stir up volatility near resistance. How price reacts around the 25,000 level will be a key signal for short-term direction.
 Usman Salis


