Eseandre Mordi

December 2025 data from Eurostat showed a split picture across Europe. Total market production in the EU rose 0.2% compared with November, while the euro area edged 0.1% lower over the same period. The figures, drawn from seasonally adjusted data, cover key sectors including industry, construction, services, and trade.
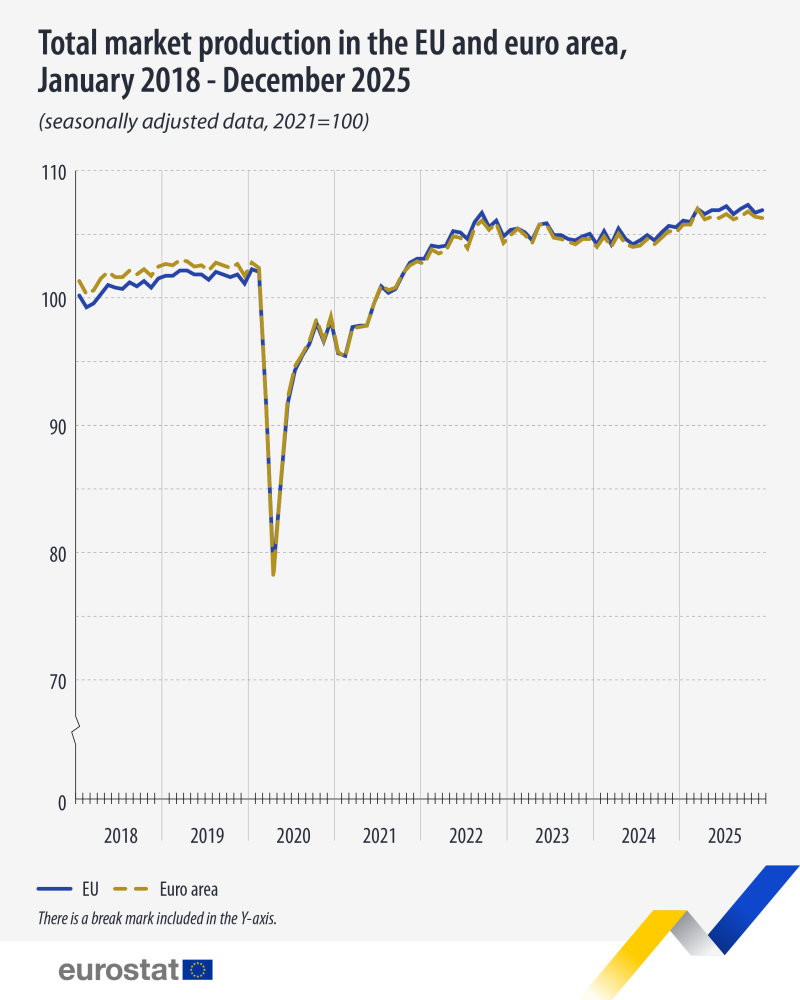
Looking further back, the production index chart spanning January 2018 to December 2025 captures just how sharp the 2020 collapse was. Output across both regions fell dramatically before a gradual, multi-year recovery lifted production back above the 2021 base index of 100. By late 2025, both the EU and the euro area had climbed to roughly 105 to 107 on the index scale.
Both regions have generally followed a similar trajectory over time, with production levels climbing steadily above the 2021 baseline. Eurostat, December 2025 Release
On a year-over-year basis, total market production climbed 1.2% in the EU and 0.9% in the euro area compared with December 2024, pointing to modest but consistent growth. This aligns with findings from Eurozone GDP Grows 0.2% in Q3 2025 — Signs of Steady Recovery, which documented steady, if unspectacular, economic expansion across the bloc.
Structural changes within the European economy add further context to the production figures. The workforce is shifting, as detailed in EU STEM Data: 7.9M Women Scientists and Engineers Across Regions, which points to the growing weight of technical talent in driving long-term competitiveness. Meanwhile, cooling price pressures covered in EU Inflation Drops to 2.1% as Prices Near 2% Target are helping ease cost burdens on businesses across the region.
The December data underscores a pattern that has defined European economic performance in recent years: uneven monthly moves within a broader recovery trend. The EU and euro area do not always move in lockstep, yet the wider arc of both regions points in the same direction, with output gradually consolidating above pre-pandemic levels.
 Eseandre Mordi