Saad Ullah

The US Dollar Index is once again approaching a critical technical inflection point, where long-term resistance and weakening structure are beginning to align. On the monthly chart, price is holding near the 100 level but remains capped beneath a horizontal resistance zone that has rejected advances for more than a decade - placing the broader trend in focus.
A Long-Term Ceiling Comes Back Into Play for DXY
The chart clearly shows DXY pushing into a horizontal resistance band stretching back over ten years, roughly in the 110 to 114 region.
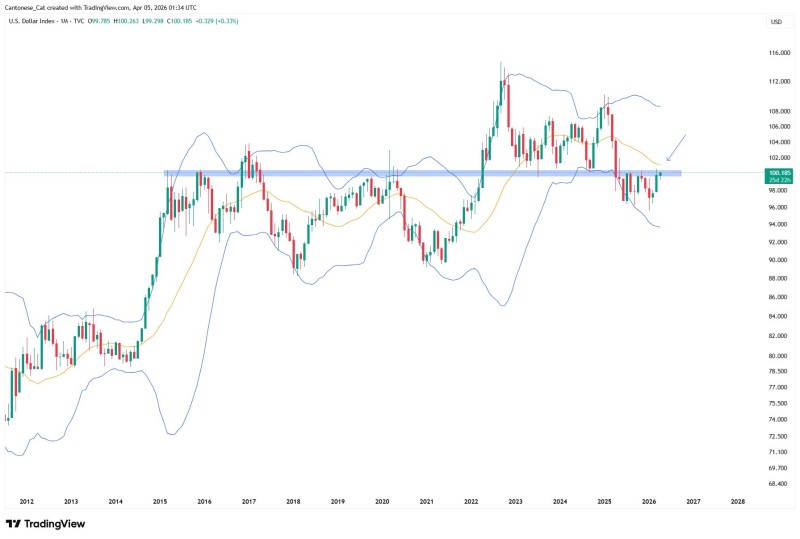
This level has consistently acted as a ceiling, rejecting prior rallies and defining the upper boundary of the index's long-term range. Analyst Cantonese Cat notes that the presence of this multi-year resistance significantly increases the probability of downside unless a decisive breakout occurs.
The presence of this multi-year resistance significantly increases the probability of downside unless a decisive breakout occurs.
The latest structure reinforces that pattern. After peaking near those highs, the dollar has failed to reclaim that zone, instead rotating lower and settling into a range closer to the 100 level. This behavior aligns with broader technical analysis seen across recent DXY market coverage, where repeated failures at resistance continue to define price action.
The 20-Month Moving Average That Flipped Into DXY Resistance
Another critical detail on the chart is the positioning of the 20-month simple moving average. Price is currently trading below this long-term average, which is now sloping above and acting as dynamic resistance. This shift carries real weight from a technical standpoint - when price loses a key higher timeframe moving average and fails to reclaim it, the broader structure often transitions from bullish to neutral or corrective.
When price loses a key higher timeframe moving average and fails to reclaim it, the broader structure often transitions from bullish to neutral or corrective.
Repeated attempts to push higher have stalled beneath this moving average, reinforcing the idea that momentum is no longer supporting upward continuation. The 200 EMA near the 100 level adds another layer of confluence to this technical picture.
Structure Shows Pressure Building Near 100 in DXY
The current price action reflects compression around the 100 level - a zone that has acted as a pivot in recent years. While DXY has managed to stabilize here, the structure does not show strength. Instead, the chart suggests a market that is:
- Failing to break long-term resistance
- Trading below the 20-month moving average
- Holding a key horizontal level without strong upside follow-through
This combination points to a setup where continuation higher requires a structural shift, not just a bounce. Recent analyses of the dollar index similarly highlight how repeated rejections near key thresholds often precede directional expansion, particularly when the index remains capped under resistance.
A Setup That Traders Are Watching Closely
The technical picture is increasingly defined by imbalance. DXY is pinned between a major ceiling above and a fragile base near current levels, with neither side fully resolving the range. In this context, the bias leans toward downside pressure as long as price remains below both the horizontal resistance zone and the 20-month moving average.
The bias leans toward downside pressure as long as price remains below both the horizontal resistance zone and the 20-month moving average.
That aligns with the broader pattern of lower highs forming since the peak - a structure typically associated with weakening trends. Analysts tracking the bearish DXY structure point to a potential move toward 95.04 if current support fails to hold.
 Saad Ullah