 Usman Salis
As of March 16, 2026, the Truflation US CPI Inflation Index shows annual inflation at 1.54%, a 0.05 percentage point uptick from the prior reading. The figure stays beneath the Federal Reserve's 2% target, though it signals building short-term price pressure. The rise comes alongside geopolitical uncertainty, with analysts noting that the duration of the Iran conflict could shape how inflation evolves in the months ahead.
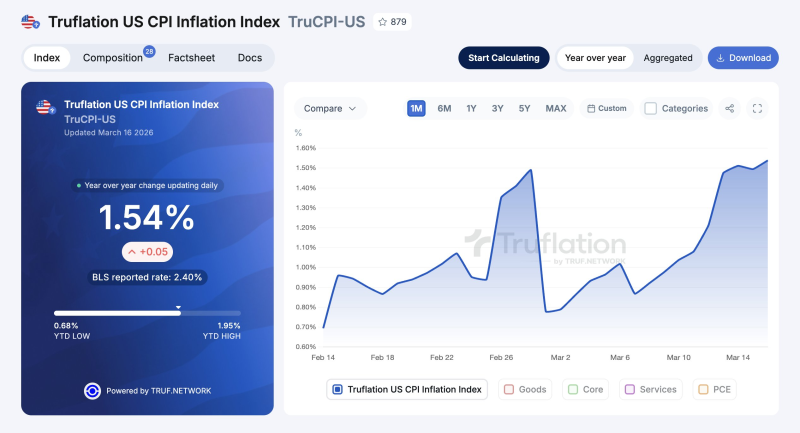
The Truflation platform pulls from real-time price data rather than waiting for monthly government releases, giving markets a faster read on consumer prices. That speed creates an ongoing gap with official figures: the Bureau of Labor Statistics currently reports CPI at 2.40%, nearly a full percentage point above the Truflation reading. This divergence was previously flagged in Truflation US CPI Falls to 1.08% as February BLS Print Forecast Near 2.4%, which broke down how daily tracking can differ sharply from monthly government data.
Inflation has ticked higher in the short term, though broader pressures may depend on geopolitical developments such as the duration of the Iran conflict.
Looking at the recent chart, the index moved from below 1% in mid-February to its current 1.54% by mid-March - a relatively sharp swing in about four weeks. A similar dynamic played out earlier this year and was covered in US Inflation Drops to 1.56% According to Truflation Data, which noted how real-time tools can capture price swings well before official figures catch up.
The broader debate about which inflation gauge to trust remains unresolved. Alternative trackers consistently print below official BLS data, but they also respond faster to shifts in market conditions and global events. With monetary policy still sensitive to inflation readings, traders and analysts watch both sets of numbers closely. The structural gap between the two approaches has been analyzed at length in US CPI at 0.94%: Truflation Data Shows Inflation Cooling Well Below the Official 2.40% BLS Rate.
 Usman Salis


