 Alex Dudov
⬤ US inflation is getting a fresh look thanks to Truflation data showing year-over-year inflation at 1.56% as of January 17, 2026. This reading comes from a real-time inflation index that tracks price changes as they happen, giving us a more current picture than traditional government reports. The gap between this figure and what official sources are saying has caught plenty of attention in financial circles.
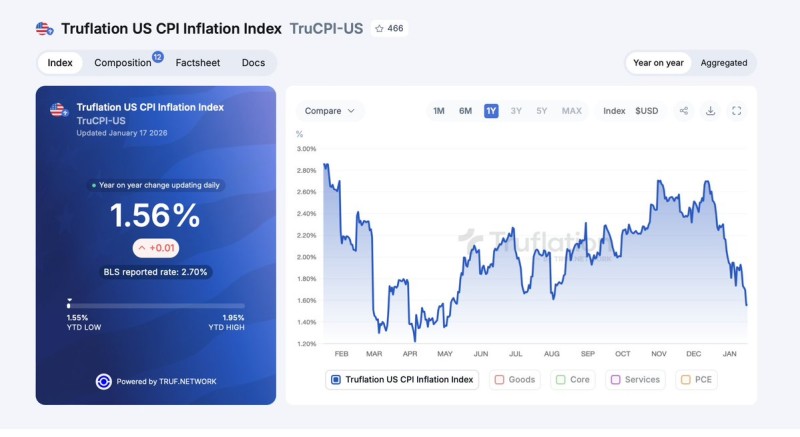
⬤ Here's where things get interesting: while the Bureau of Labor Statistics reported CPI at 2.70%, Truflation's daily updates paint a different story. The difference isn't just about numbers—it's about timing. Official CPI data comes out monthly and looks backward, but Truflation updates every single day using live pricing information from actual transactions happening right now.
⬤ Looking at the past year, Truflation's readings have been bouncing around before settling into this downward trend we're seeing now. The index hit a year-to-date low recently, basically confirming that price pressures have cooled off compared to where we were months ago. The latest daily movement was barely noticeable at +0.01%, showing things are pretty stable rather than swinging wildly in either direction.
⬤ Why does this matter for markets? Because inflation expectations drive everything from Fed policy decisions to how investors feel about risk. Truflation's lower reading gives us a heads-up about where official CPI numbers might be heading in the coming weeks. If government data starts moving closer to what Truflation is showing, it'll confirm what real-time pricing is already telling us—inflation is cooling down, and that changes the entire conversation around economic conditions and market outlook.
 Alex Dudov


