 Marina Lyubimova

Inflation may be turning faster than expected, with real-time data pointing to a sharp acceleration after a period of cooling. As Cantonese Cat 🐱🐈 highlighted, the Truflation index surged from roughly 0.7% to 1.75% year-over-year within a short timeframe - a move that underscores how quickly inflation dynamics can change.
The Truflation Reversal That Breaks the Cooling Trend
The chart shows a clear downward trajectory in inflation through late 2025 into early 2026, with readings falling toward the 0.7% range. This formed a consistent pattern of declining momentum.
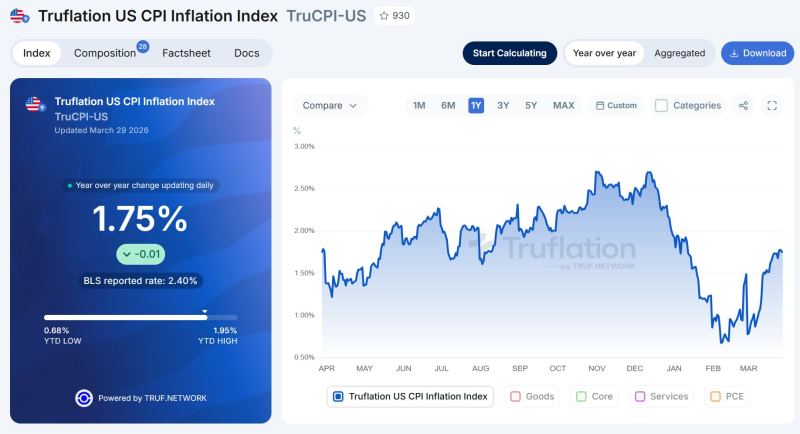
The latest move disrupts that structure. Instead of continuing lower, the index rebounds sharply - creating a visible inflection in the trend. The shift from sub-1% levels to 1.75% represents a clean break from the prior downward sequence.
Instead of continuing lower, the index rebounds sharply - a visible inflection that breaks the consistent downward sequence formed through late 2025.
US Inflation Cooling: Truflation CPI Slips to 0.79% captured the low point of that cooling trend, providing a useful baseline for just how sharp the current reversal looks against where the index was just weeks ago.
Why the Speed of the Truflation CPI Move Stands Out
The significance of the current reading lies in the pace of change. A near-doubling from approximately 0.7% to 1.75% within weeks reflects a rapid adjustment in inflation dynamics rather than a gradual normalization.
Real-time trackers like Truflation capture changes continuously, making sudden reversals more visible compared to traditional reporting frameworks. The chart reflects this responsiveness - a sharp V-shaped move rather than a gradual climb is exactly the kind of signal these trackers are designed to catch early.
Real-time trackers capture shifts earlier in the cycle - a sharp V-shaped move rather than a gradual climb makes the current reversal harder to dismiss as noise.
Truflation CPI Jumps to 1.47% as Inflation Volatility Returns tracked an earlier acceleration phase, showing that this kind of volatility in the Truflation index has been building for some time before the current jump to 1.75%.
A Gap Between Real-Time and Reported Inflation Data
The chart also highlights a divergence between Truflation's current reading at 1.75% and the BLS reported rate of 2.40%. While official data remains higher, the real-time index captures directional shifts earlier in the cycle - and the direction it is now showing is up.
The current structure reflects a transition rather than a confirmed trend:
- Recent low: ~0.7%
- Current level: ~1.75%
- Prior highs: ~2.5%+
- Structure: break from downtrend into rebound
Truflation US CPI Falls to 1.08% as BLS Forecast Holds Near 2.4% showed how the gap between real-time and official data behaved during the cooling phase - and now that same gap is narrowing from below as Truflation rebounds while the BLS rate holds steady above 2%.
 Marina Lyubimova


