 Usman Salis
Japan's inflation is once again undershooting its target, and the latest data suggests the trend is closely tied to a prolonged slowdown in money supply growth. According to Steve Hanke, inflation came in at 1.26% in February, while M2 money supply is growing at just 1.73% - well below the level historically associated with stable inflation.
Japan M2 Supply Collapses From 10% Peak to 1.73% by 2026
The chart shows a sharp rise in Japan's M2 money supply growth during 2020-2021, where it surged toward the 9-10% range. That period marked the peak of monetary expansion.
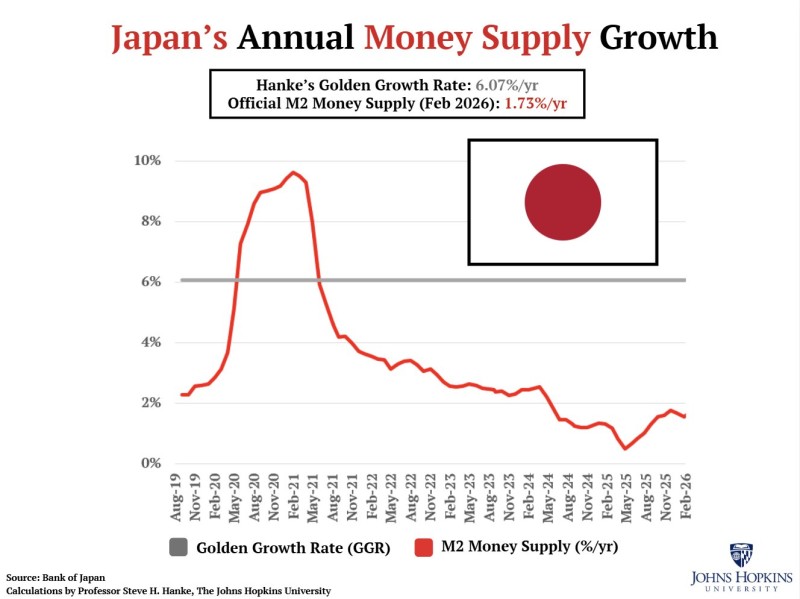
Since then, the structure has reversed decisively. Growth rates have trended lower in a clear and sustained downtrend, with each rebound failing to break previous highs. By 2026, M2 growth has fallen to 1.73% year-over-year, confirming a persistent decline in liquidity expansion.
Inflation came in at 1.26% in February, while M2 money supply is growing at just 1.73% - well below the level historically associated with stable inflation.
This pattern reflects a complete transition from aggressive expansion to a restrained monetary environment.
The Gap Between Japan's M2 and the 6% Golden Growth Rate
A key feature of the chart is the divergence between actual money supply growth and the so-called "Golden Growth Rate" of approximately 6.07%. The grey benchmark line remains steady near 6%, while the red M2 line has stayed consistently below it since 2022. The gap has widened over time, reaching one of its largest spreads in the most recent data.
- M2 growth peaked near double digits during 2020-2021
- Growth declined below 4% by 2022 and continued trending lower
- Current levels around 1.7% remain far below the 6% benchmark
This divergence is central to the argument that inflation pressures are structurally limited when money supply growth remains suppressed. Meanwhile, USD/JPY watches BOJ pause odds as inflation slows, adding a policy dimension to the liquidity discussion.
Japan Inflation Trend Mirrors Weakening M2 Structure
The chart's downward trend in M2 growth aligns with the softer inflation reading highlighted in the analysis. The relationship is not presented as a short-term fluctuation but as a consistent pattern: lower money supply growth coincides with weaker inflation outcomes.
The gap has widened over time, reaching one of its largest spreads in the most recent data.
Recent market commentary also reflects cooling inflation dynamics more broadly, with data showing inflation readings falling below expectations and influencing policy outlooks. Japan's 10-year yield climbs toward a 17-year peak, a dynamic that further complicates the inflation picture. The lack of sustained recovery in M2 growth - despite minor upticks - suggests that underlying momentum remains weak.
Liquidity Remains the Defining Constraint
The chart does not show volatility or sharp reversals, but rather a steady decline followed by shallow stabilization. Even the recent bounce into early 2026 fails to challenge the broader downtrend or approach the benchmark level.
Unless money supply growth accelerates meaningfully toward the 6% range, the current structure suggests that inflation is likely to remain below target rather than break higher.
In this framework, inflation appears anchored by monetary conditions. With M2 growth at 1.73% and inflation at 1.26%, the alignment underscores a consistent relationship between liquidity and price behavior. BOJ pushes rates to the highest level in 30 years - yet even that shift has done little to alter the structural trend in money supply expansion.
 Usman Salis


