Peter Smith
⬤ XRP is drawing renewed attention after a long-term chart pattern on the Bitstamp three-month view flagged a possible move toward $70. Analyst CryptoBull put it plainly: "#XRP to $70 is happening now." The chart covers over a decade of price history and highlights a compression structure that looks like it may finally be resolving right now.
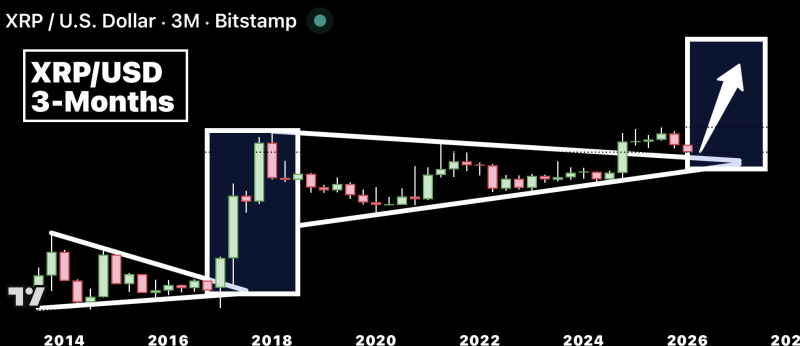
⬤ The XRP/USD chart maps out a clear story. There was a sharp vertical spike in 2017-2018, then years of slow, grinding consolidation. Out of that came a symmetrical triangle - highs steadily lower, lows steadily higher, price coiling tighter with each passing quarter. That kind of setup typically signals a big directional move is brewing. A boxed projection at the right edge of the chart shows an upward arrow breaking above the converging trend lines, pointing toward a sharp bullish extension.
⬤ The $70 target might look bold, but it fits the broader narrative analysts have been building around XRP. XRP Price Forecast: Analyst Eyes $15 by March, $70 by May lays out how current momentum could push XRP through both levels if the compression breaks with enough force - long consolidations have a way of producing outsized moves when they finally resolve. For wave-based context, XRP Price Prediction: Ripple Eyes $4-$10 Range with Elliott Wave Confluence supports the same idea, showing breakout dynamics across multiple timeframes through Elliott Wave analysis.
⬤ A symmetrical triangle that builds over years - not weeks - tends to get serious attention from traders. XRP has been compressing since 2018, and the market is now watching closely to see whether price breaks into a new range or stalls near current levels. Either way, the pattern has become a reference point, and targets like $70 are anchoring the wider conversation about where XRP goes next.
 Peter Smith