Saad Ullah
⬤XRP has lived through some brutal market cycles. Since its early trading days, the token has dropped more than 70% at least five times - including the current cycle stretching into 2026. That's a rare but recurring pattern, and long-term chart data backs it up clearly.
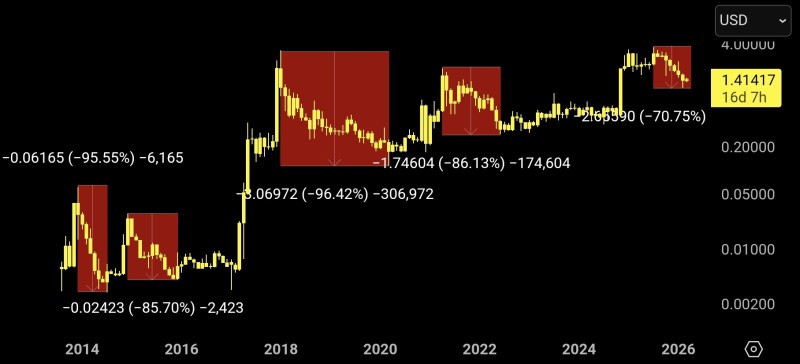
⬤The historical chart tells a stark story. Early cycles saw XRP shed as much as 85% to 96% of its value, with later phases still delivering corrections well beyond 70%. These weren't flash crashes - they were sustained drawdowns that followed strong price expansions, eventually giving way to extended consolidation before the market found its footing again.
⬤The current price area around $1.41 fits squarely within this long-term framework. If history rhymes, this could be another transitional phase. Technical analysts watching the chart have noted that XRP tends to compress into tight consolidation patterns after major selloffs - a triangle squeeze that often points to sharp volatility once pressure builds enough to break one way or the other.
⬤That same compression dynamic shows up across multiple timeframes. Analysts tracking a symmetrical triangle breakout approaching see the structure tightening - a setup that's preceded significant moves before. And for those with a longer view, some models suggest XRP could target the $5-$12 range if it clears the 6-year triangle breakout that's been forming since 2018. Whether this correction follows the same script as the previous four remains to be seen - but the historical precedent is hard to ignore.
 Saad Ullah