 Saad Ullah
XRP is back on analysts' radars - and for a compelling reason. A major multi-year chart structure may have just resolved, opening the door to price levels that seemed distant only a year ago. Analyst Ahmed Ibrahim recently identified a six-year consolidation pattern in XRP that could define the next leg of the token's long-term trajectory.
6-Year Triangle Pattern and the $3.66 Breakout
The formation spans from the 2017-2018 cycle all the way through 2024. XRP's symmetrical triangle developed between a floor near $0.11 in March 2020 and a confirmed breakout above $0.50 in November 2024. Inside this structure, XRP traced a classic ABCDE corrective wave with key turning points at $0.11, $1.96, $0.30, $0.74, and $0.50 - marking the close of each wave before the breakout occurred.

After clearing that structure, XRP surged to an all-time high of roughly $3.66 in July 2025. Since then, the token has pulled back toward the $1.38 region - a move that, according to the analysis, fits neatly within a broader reaccumulation phase rather than signaling a trend reversal.
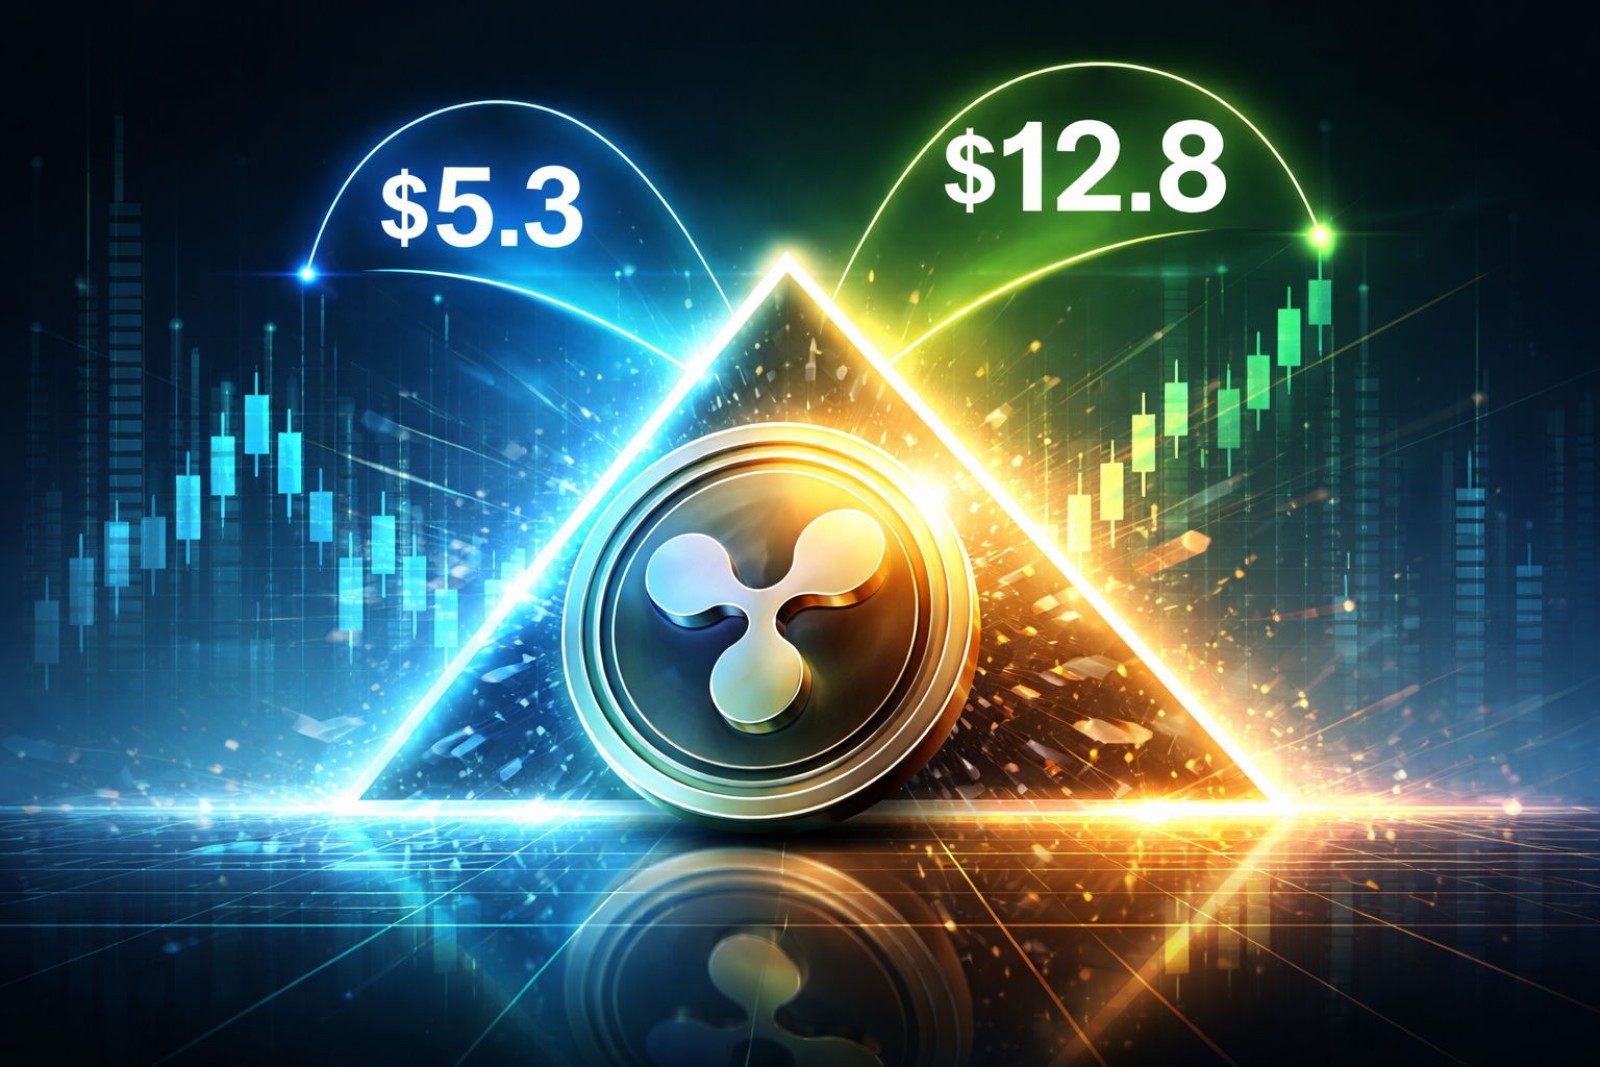
$5.3, $8.6, and $12.8: What the Chart Projects Next
If the breakout pattern continues to develop as mapped, intermediate targets sit at approximately $5.3 and $8.6, with a longer-term projection toward $12.8 by late 2028. These levels aren't arbitrary - they reflect measured-move extensions that commonly follow multi-year triangle resolutions in crypto markets. Historical precedent shows that symmetrical triangles of this scale - where volatility compresses over years - tend to precede extended directional moves once resistance is cleared.
The broader picture reinforces this view. XRP's prolonged consolidation period mirrors patterns seen in prior crypto cycles, where multi-timeframe triangle formations signaled the start of major trend cycles. How XRP interacts with historical resistance levels in the coming months will likely determine whether the projected targets become realistic milestones or remain aspirational.
 Saad Ullah


