 Artem Voloskovets

⬤ Stellar (XLM) just broke through a descending trendline that's been weighing on the price for months, now holding around $0.23 on the 12-hour chart. XLM also cleared a horizontal resistance zone right above it, setting up what looks like a promising technical picture. After weeks of sliding lower inside a falling channel, the coin finally bounced hard enough to push back toward the top of that structure.
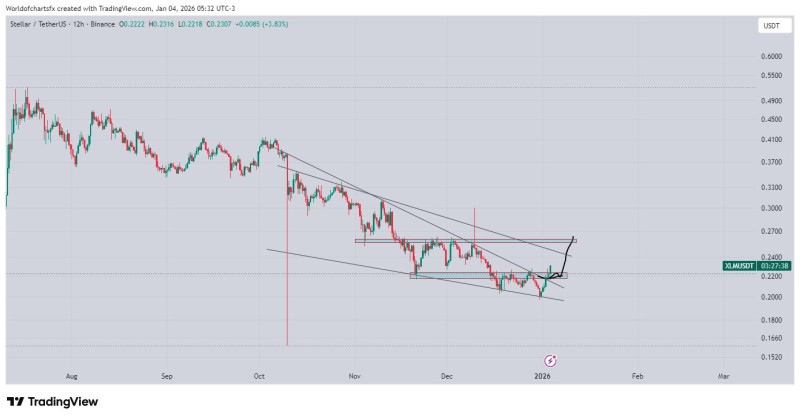
⬤ The chart suggests that if XLM can successfully retest the broken trendline and hold it as support, that would confirm the breakout is real. Right now it's trading between $0.22 and $0.23, and the next meaningful resistance sits around $0.27 to $0.28—a zone where the price consolidated and struggled before. The projected path shown on the chart indicates Stellar could extend its climb from here straight toward that previous supply area.
⬤ For months, XLM stayed trapped inside that descending channel, bouncing between the top and bottom before finally breaking out. This changes the technical story—instead of watching support under $0.20, traders are now looking at resistance between $0.25 and $0.30. The $0.22 zone that just flipped from resistance could become important support going forward.
⬤ What makes this interesting is that it marks a real shift in momentum after a long downtrend. Whether Stellar can stay above this breakout level and actually push toward $0.27-$0.28 will tell us a lot about where it's headed next. If it holds, the technical setup looks solid. If it fails, we're probably heading back down to test the bottom of that old channel.
 Artem Voloskovets


