 Usman Salis

⬤ XLM has once again reached the pivotal $0.23 support zone, drawing heightened interest across the market. The token has reacted strongly at this exact level multiple times this year, and the current 3-day chart shows XLM trading near $0.2355 as it attempts to find its footing.
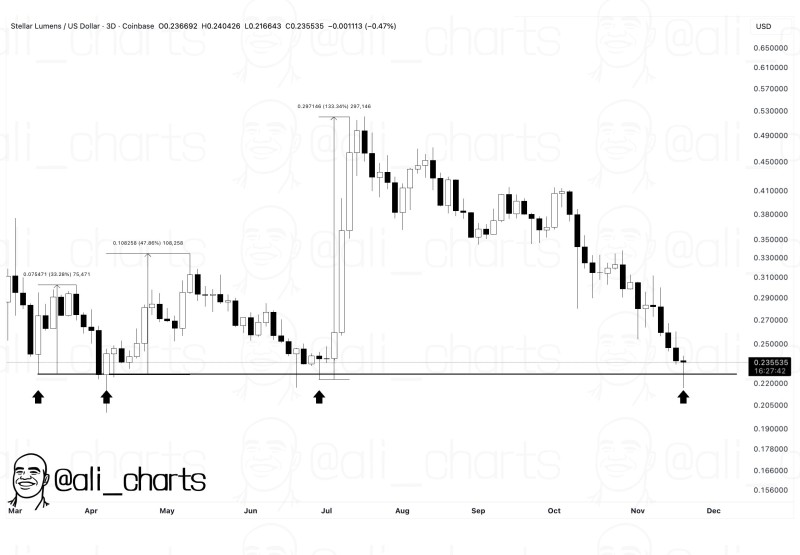
⬤ Here's where it gets interesting: the chart shows three previous interactions with the $0.23 zone that sparked rebounds of roughly 33%, 48%, and 133%. Each surge happened right after XLM touched this horizontal support line, which has consistently acted as a major demand zone. The latest drop brought XLM down from the $0.33-$0.35 range, with steady downward pressure throughout November. The pattern is clear—whenever XLM hit $0.23 before, it launched into multi-week rallies.
⬤ Right now, XLM is sitting directly above that same support, with repeated lower wicks showing continued buyer interest near the $0.23 region. The chart also reveals a series of lower highs in recent months, pointing to ongoing market weakness. Whether XLM can pull off another historical rebound depends on how well buyers defend this area over the next few sessions.
⬤ This level matters because $0.23 has repeatedly defined XLM's medium-term structure. Holding above it would keep the established range intact and could boost sentiment if a new rally kicks off. A breakdown, though, would signal a clear trend shift and potentially open the door to broader downside across altcoins. The next few days will show whether XLM sticks to its pattern or enters a new phase.
 Usman Salis


