 Saad Ullah

⬤ Solana is trading around $93.6 on the 4-hour chart, edging toward a horizontal resistance cluster near $96. The current push follows a rebound from demand levels established earlier in the cycle, with buyers steadily reclaiming lost ground. Analysts are watching whether SOL can absorb selling pressure at this supply zone or get turned away again.
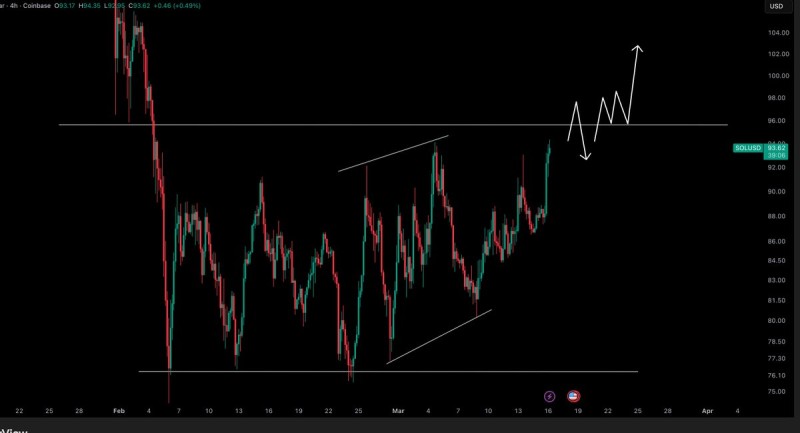
⬤ The recent rally started from the $76 to $77 support band, where price found a floor after a sharp selloff. SOL then began printing higher lows, signaling that buyers were gradually taking control. This recovery from $76 support toward $90 resistance follows a pattern analysts have flagged repeatedly: a defined trading range with $76 as the floor and the mid-$90s as the ceiling.
The recent rally could represent a test of a supply zone before the market decides whether it can reclaim the level and continue higher.
⬤ The $96 area has previously acted as a ceiling where upward momentum stalled. A confirmed breakout above it could open the door to a move past $100. This mirrors the setup discussed in the SOL price analysis covering $92 resistance after the $80 bounce, where analysts noted that clearing range resistance tends to trigger stronger follow-through buying.
⬤ The outcome at $96 carries weight for the short-term trend. A close and hold above the level would shift momentum toward a broader recovery. Failure to break through, however, would likely keep SOL rangebound. As highlighted in the analysis of Solana holding $87 support, these horizontal zones consistently shape direction as buyers and sellers compete for market control.
 Saad Ullah


