 Alex Dudov
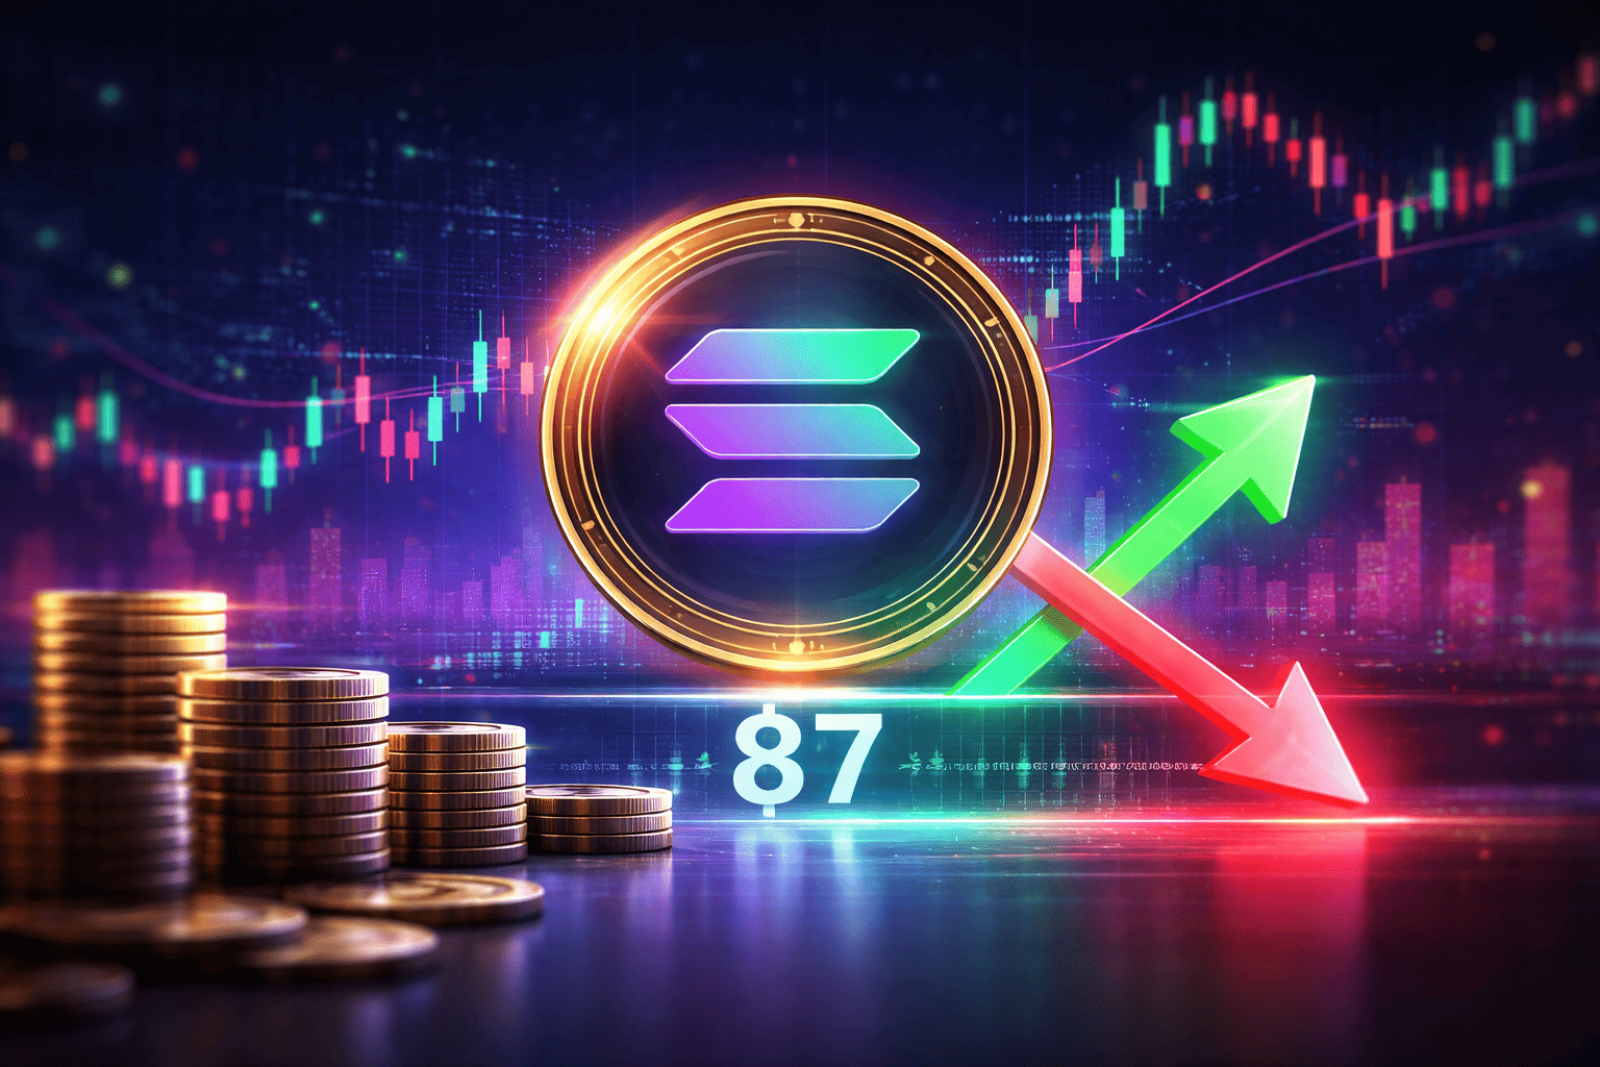
Solana is trading near a critical technical level after a prolonged decline pushed the asset into the mid-$80 range. The chart shows SOL/USD stabilizing around $87 while interacting with a cluster of support levels that emerged following the recent selloff. Two potential scenarios are now on the table as the market weighs whether the current consolidation leads to recovery or deeper volatility.
$76 Floor vs. $95 Ceiling: Solana's Key Price Levels Explained
The technical structure shows Solana trading below a descending moving average after recovering from lows near $67. Price is now consolidating between the $76.69 support zone and resistance near $94.91 - the horizontal levels where buyers and sellers are actively competing. This dynamic aligns with earlier findings in SOL Price Analysis: Only 20% of Solana Supply in Profit as 80% of Holders Stay Underwater, which highlighted the heavy losses across the holder base during the correction.
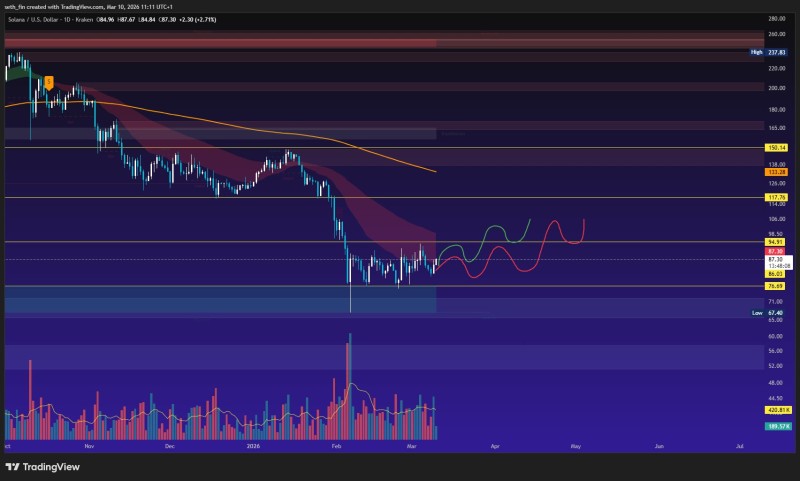
Two Scenarios: Recovery to $95 or Another Volatility Wave?
The chart outlines two projected paths. The bullish case suggests SOL could gradually climb toward $95 and attempt a broader recovery. The bearish case points to another wave of volatility and a possible revisit of lower support before any sustained rally begins. As noted in Solana Holds $86-$91 Support as Uptrend Structure Persists, the mid-$80 zone has acted as a reliable demand area through multiple tests.
Despite recent weakness, Solana remains a central player in the altcoin market. While Ethereum is widely viewed as the institutional infrastructure layer, SOL continues to attract significant retail trading activity. The consolidation near $87 may represent a defining moment - the market is essentially deciding right now whether SOL pushes toward resistance or retests deeper support. For further context on upside targets, Solana Eyes $100 Target After Breaking Key $88 Range outlines the conditions needed for a broader breakout.
 Alex Dudov


