 Saad Ullah
⬤ Solana is back at a make-or-break price level. After finding solid footing near $76, SOL pushed sharply higher, climbing straight into the $88-$90 resistance zone on the 12-hour chart. The move puts SOL right under a well-defined overhead supply area. What happens at $90 will likely set the tone for SOL's next directional move.
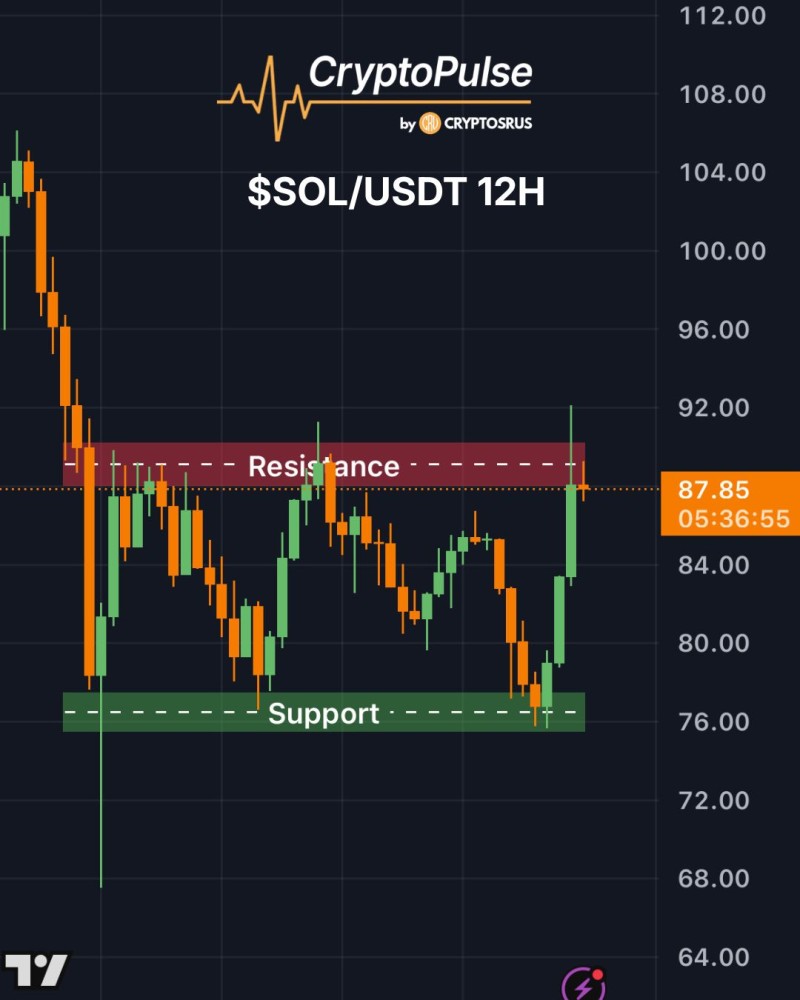
⬤ The chart tells a clear story: Solana has been ranging between $76 and $90, with buyers consistently stepping in at the lower boundary and sellers pushing back near the top. The $76 level has held as SOL price analysis testing key support levels has shown multiple times. Until price can close convincingly above $90, this range structure stays intact and keeps short-term action choppy.
⬤ The key question now is whether SOL can flip $90 from resistance into support. A sustained close above that level would signal seller exhaustion and open the door to fresh upside. Failure to break through, though, could drag price back toward the $81 mid-range area and eventually retest $76. This dynamic was already flagged in SOL trading in $76-$90 range as breakout toward $100 draws closer, underscoring just how critical these horizontal levels have become.
⬤ For now, SOL sits in neutral territory - neither bullish nor bearish until the range resolves. A decisive breakout above $90 would shift momentum across altcoin markets, while a break back toward support would keep the consolidation narrative alive. It's also worth watching the BTC pair, as Solana weakens vs BTC with $48-$29 target zone in focus points to broader relative weakness that could weigh on any recovery attempt.
 Saad Ullah


